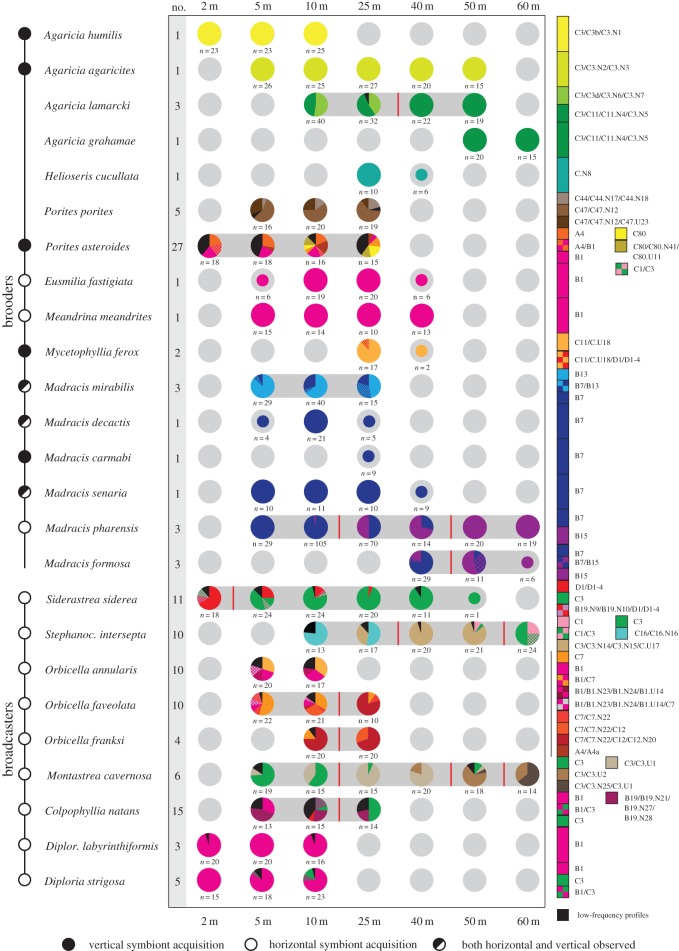
Figure 2.
Relative abundances of Symbiodinium ITS2 profiles over depth (2–60 m) for 25 scleractinian species on the Buoy 0/1 study site in Curaçao. Pie graphs joined by grey shading indicate significant changes in Symbiodinium community over depth (ANOSIM), and red lines indicate ‘break points’ where the Symbiodinium community is significantly different at either side of the line. Smaller pie graphs indicate sampling depths where less than 10 colonies were found/sampled (not included in ANOSIM). Coloured circles in front of the species names indicate whether endosymbionts are reportedly acquired vertically, horizontally, facultatively or whether acquisition mode remains unknown (based on [26,34] and P.R.F. & P.B. 2004, personal observations for Madracis). Numbers next to species indicate Symbiodinium profile diversity (i.e. number of observed profiles).

