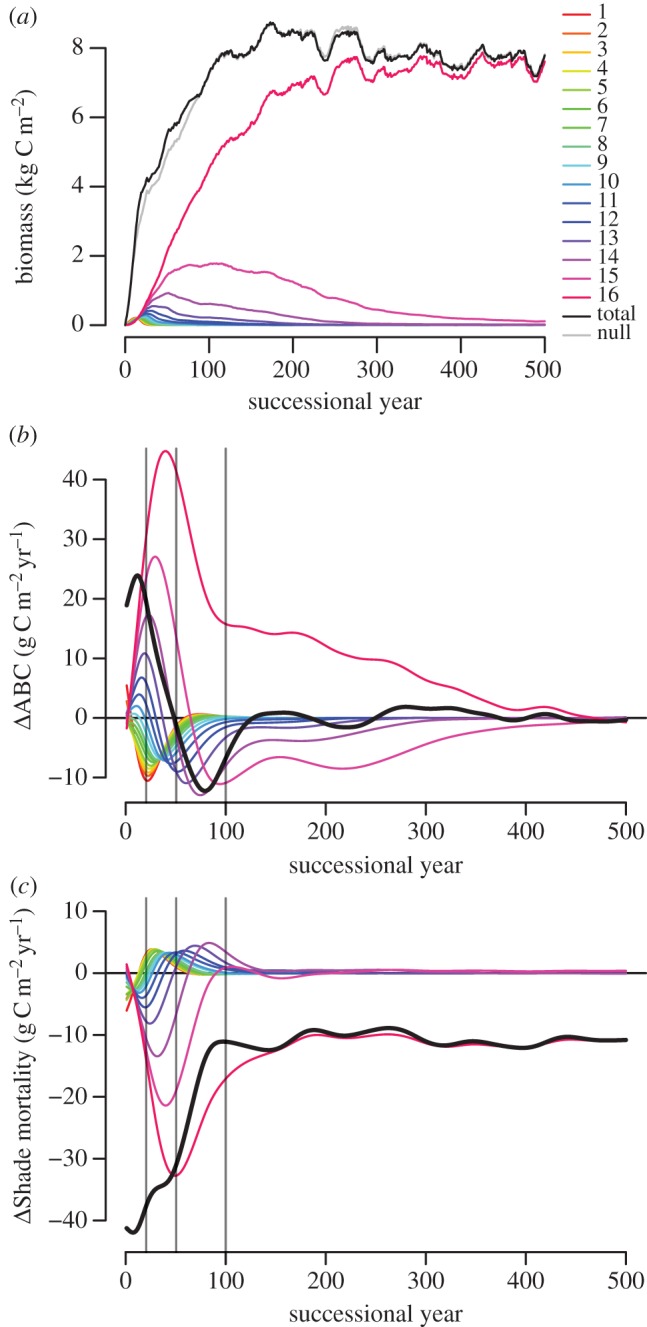
Figure 5.

Successional development of the stand with all 16 species. Coloured lines each represent a species with their colour indicating their ID. In (b–c) lines were smoothed to make trends clearer. Vertical lines separate the four different time periods. A leading Δ denotes the biodiversity effect in the following variable (difference between observation and null model expectation). (a) Development of individual and total biomass (kg C m−2) over time. Black line: total biomass (BM) observation, grey line: total BM expected according to null model. (b) Development of individual and total ΔABC (g C m−2 yr−1) over time. (c) Development of individual and total ΔShade mortality (g C m−2 yr−1) over time.
