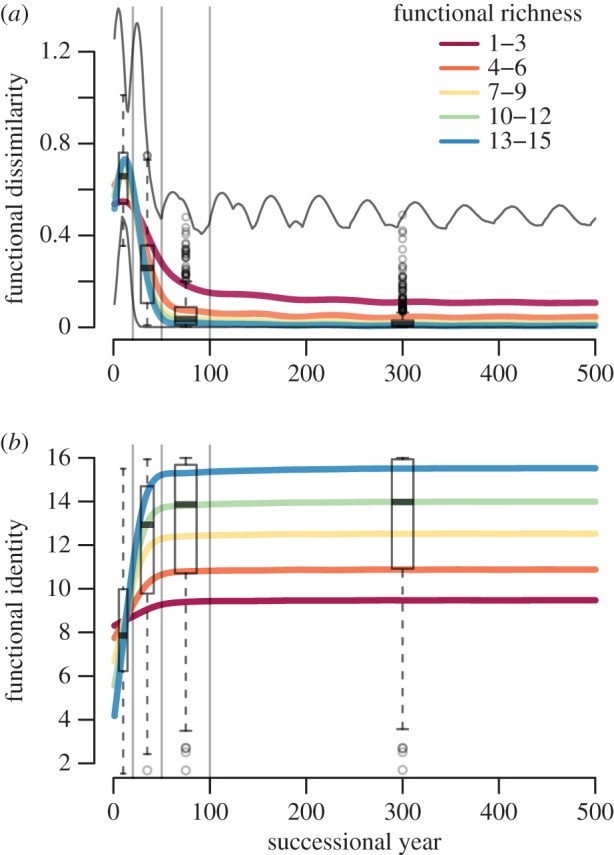
Figure 6.

Development of functional composition during forest succession. Vertical lines separate the four different time periods. Functional dissimilarity and identity were averaged annually over the scenarios grouped by functional richness (range of the hyper-trait, which remains constant), as indicated by the colours. (a) Functional dissimilarity (Rao's Q). Grey lines mark lower and upper extremes of Rao's Q. (b) Functional identity (CWM of the hyper-trait). Boxplots indicate the distribution in the time periods (median as bold line, hinges as interquartile ranges (IQR) and whiskers extend from there to the extremes or 1.5 times the IQR, whichever is shorter, beyond that single runs as points).
