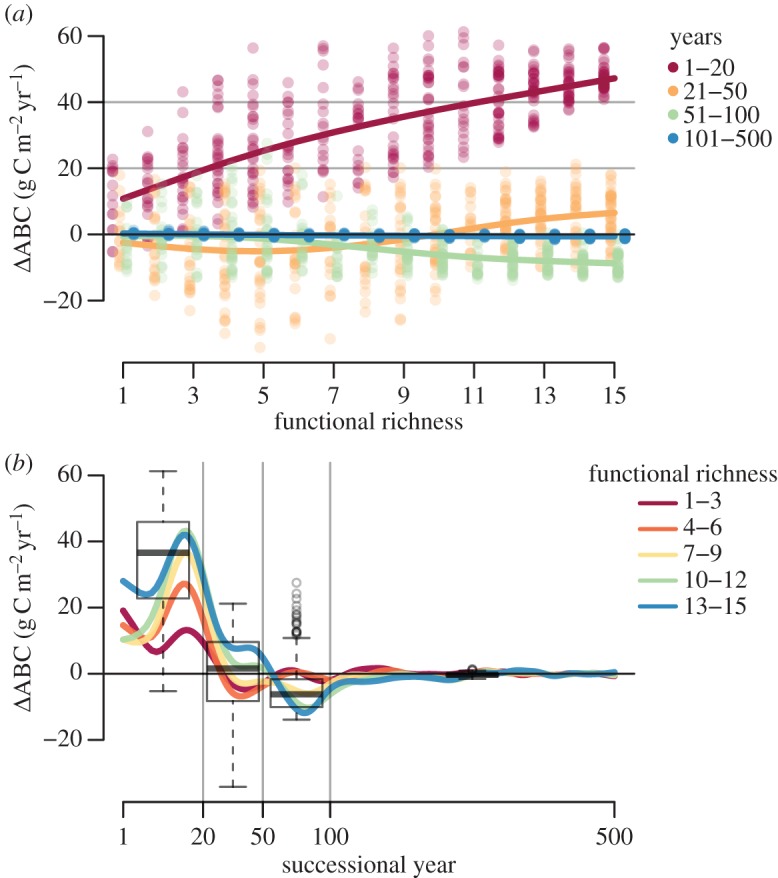
Figure 7.

Biodiversity effect in ABC (ΔABC) over functional richness and time. (a) Over functional richness (range of the hyper-trait), with a small shift to enhance visibility. Each dot represents the average from a scenario run over the time period. Time periods are shown in different colours. Dots are overlaid by smoothed splines to guide the eye. (b) Over time, smoothed splines show annual averages in five groups of functional richness, as indicated by the colours. Boxplots indicate the distribution in the time periods (median as bold line, hinges as interquartile ranges (IQR) and whiskers extend from there to the extremes or 1.5 times the IQR, whichever is shorter, beyond that single runs as points). Vertical lines separate the four different time periods.
