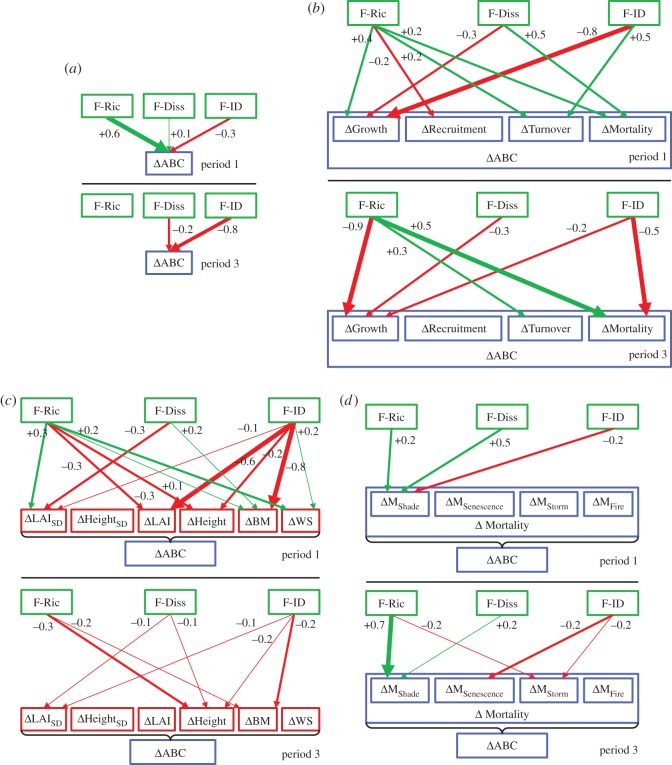
Figure 8.
Aggregated results from path models for periods 1 (top) and 3 (below). With four versions of aggregated effects (SPC) of FC metrics on biodiversity effects in ABC (ΔABC): (a) ‘complete’, (b) ‘via rates’, (c) ‘via states’ and (d) ‘via mortality processes’. A leading Δ denotes the biodiversity effect in the following variable (difference between observation and null model expectation), which applies here to every variable except for FC. Arrow colours reflect the sign (green, positive; red, negative) and boldness the strength of the SPC with line widths 1–3 corresponding to |SPC|≥0.1 and <0.2 (thin), ≥0.2 and <0.5 (medium), ≥0.5 (bold); only significant paths and paths with |SPC|≥0.1 are shown. The SPC estimates are placed directly adjacent to the arrows. Box colours: green, FC metrics based on functional traits; red, states; blue, rates. In (b), the effects via the rates sum up to the total effects on ΔABC, indicated by the surrounding frame, in (c) the effects via the states do not. In (d), ΔMShade, ΔMSenescence, ΔMStorm include their indirect effect via ΔMCrushing, such that all four processes sum up to the total ΔMortality, indicated by the surrounding frame. F-Ric, functional richness; F-Diss, functional dissimilarity; F-ID, functional identity; ABC, annual biomass change; LAI, leaf area index; BM, biomass; WS, water stress; M, Mortality.

