
Figure 2.
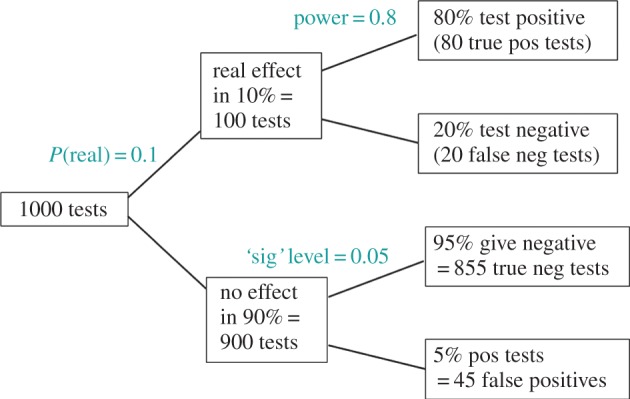
Tree diagram to illustrate the false discovery rate in significance tests. This example considers 1000 tests, in which the prevalence of real effects is 10%. The lower limb shows that with the conventional significance level, p=0.05, there will be 45 false positives. The upper limb shows that there will be 80 true positive tests. The false discovery rate is therefore 45/(45+80)=36%, far bigger than 5%.