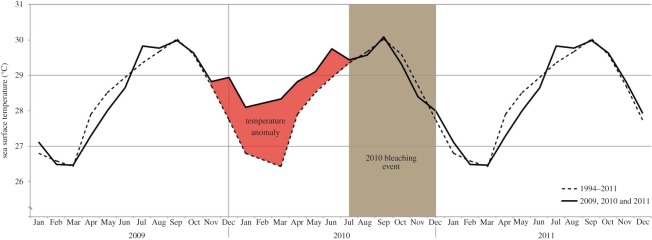
Figure 1.

Comparison of the monthly average sea surface temperatures from 1994 to 2011 (dashed line) and the monthly average temperature observed in 2009, 2010 and 2011 (continuous line). In La Parguera, the 2010 bleaching event (brown box) lasted from June–July to November–December and is linked to the continuous temperature anomaly (red box) observed between November 2009 and June–July 2010. During the temperature stress period, temperatures were 1 to 2°C higher than the average for the region.
