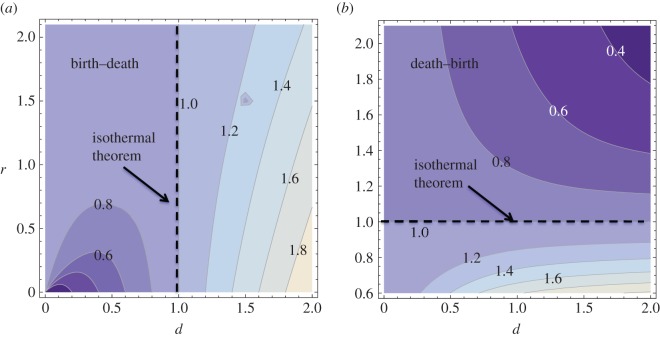
Figure 3.
One-dimensional process: comparison of the BD and DB processes with the non-spatial process. (a) The ratio πBD−1D/πMoran is plotted as a function of variables d and r. The contours correspond to equal values of this quantity, and lighter colours mark higher values. (b) The same, for the function πDB−1D/πMoran. The parameter N=100 is used.

