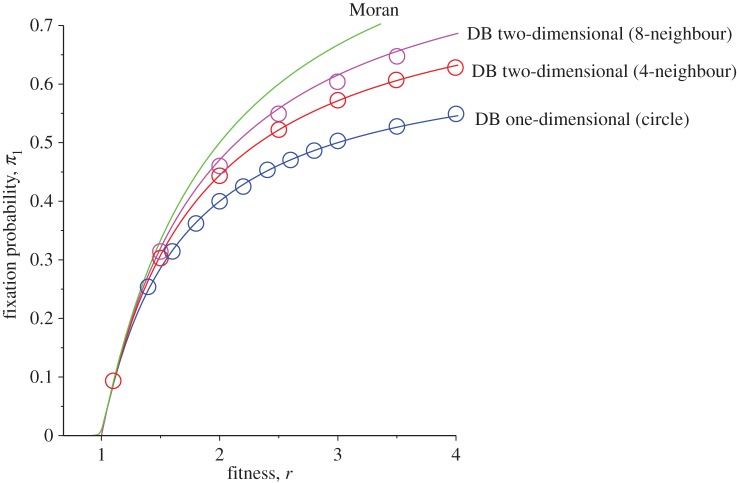
Figure 7.
Comparison of analytical results for the fixation probability π1 as a function of the division rate r for one-dimensional DB (N=20) and two-dimensional DB (N=20×20) cases with k=4 (4-neighbour) and k=8 (8-neighbour) regular lattices with periodic boundary conditions. The solid lines are analytical results from equation (4.7) (mixed population Moran model), equation (5.3) (one-dimensional DB with d=1) and equation (6.3) (two-dimensional DB with d=1), while circles are the results of stochastic simulations with 40 000 iterations.

