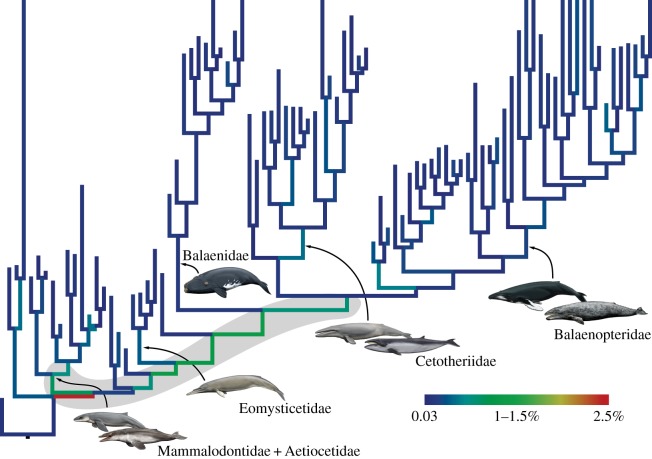
Figure 3.
Combined phenotypic/genomic evolutionary rates. Branches are colour-coded by rate, with the fastest change occurring along the stem lineage (highlighted in grey) leading from the mysticete stem branch to all major clades. Topology, time scale and names are the same as in figure 2.

