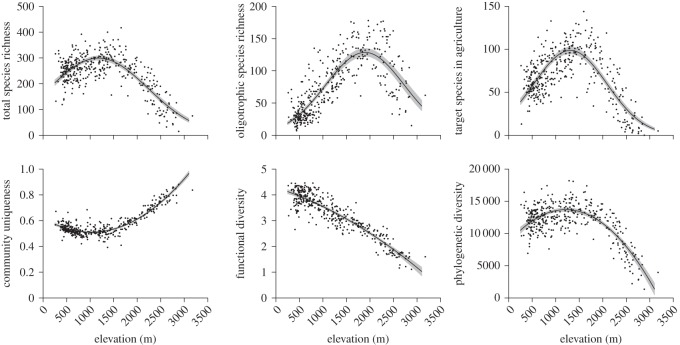
Figure 2.
Values of six measures of plant diversity along the elevational range covered in the Swiss Biodiversity Monitoring programme. Points are 381 study plots, black lines are regression lines from LMs with linear, quadratic and cubic polynomials of elevation as predictor variables, and grey areas are 95% credible intervals for model predictions.

