Figure 2.

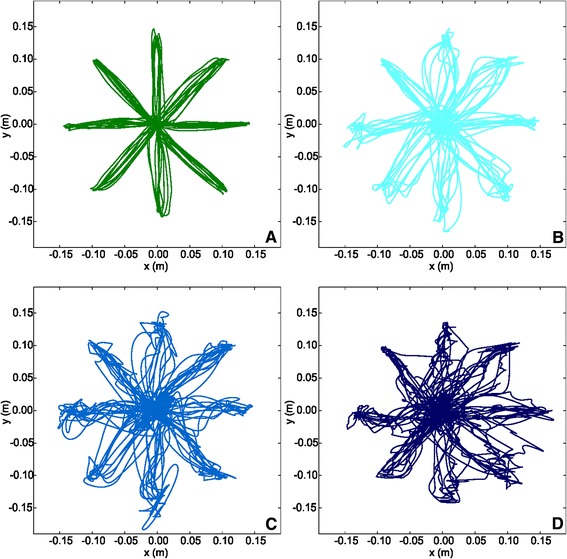
Plot of the path traced by a representative subject from the control group (A), and by three FRDA patients with different SARA scores: 15 (B), 24.5 (C), and 39 (D).

Plot of the path traced by a representative subject from the control group (A), and by three FRDA patients with different SARA scores: 15 (B), 24.5 (C), and 39 (D).