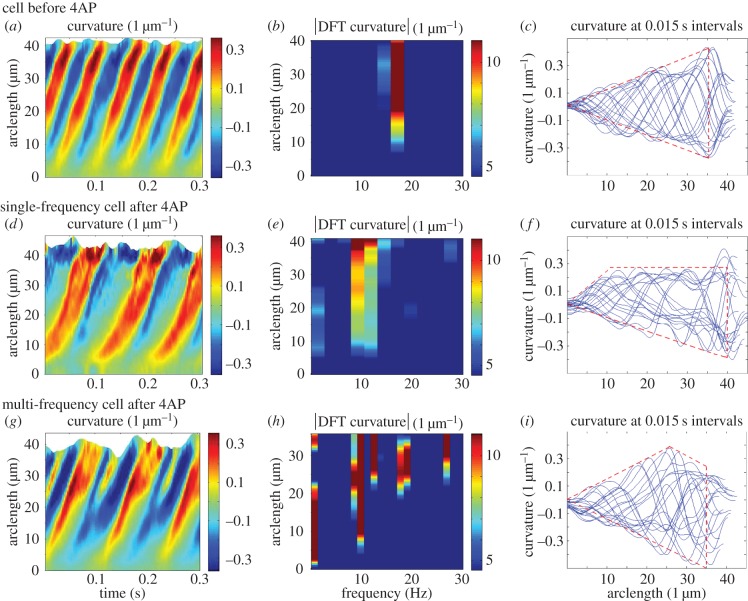
Figure 1.
Plots of curvature of representative single- and multiple-frequency beat cells before and after stimulation with 4AP. Before stimulation with 4AP: (a) spatio-temporal distribution of curvature; (b) magnitude of the temporal discrete Fourier transform (DFT) of curvature as a function of frequency and arclength, which increases away from the head-flagellum junction; (c) curvature versus arclength at different time levels; and their corresponding plots after stimulation in (d–f), respectively, for the single-frequency beat cell and (g–i), respectively, for the multiple-frequency beat cell. Red dashes emphasize the variability in beat envelope between different cells.

