Figure 4.
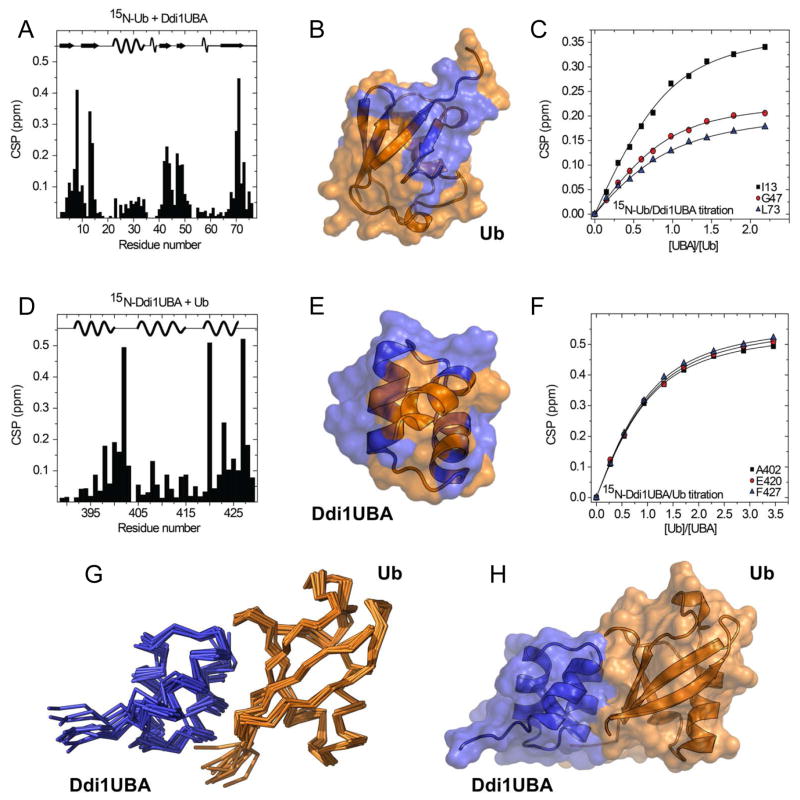
Characterization of Ub-Ddi1UBA binding by NMR. (A–C) Titration of 15N-labeled Ub with Ddi1UBA. (A) Amide chemical shift perturbations (CSPs) in Ub at the titration endpoint. (B) CSP-based mapping of Ddi1UBA-binding site (colored blue) on the surface of Ub (orange). (C) Titration curves for selected Ub residues in close proximity to the hydrophobic patch. (D–F) Titration of 15N-labeled Ddi1UBA with Ub. (D) CSPs in Ddi1UBA at the titration endpoint. (E) Map of the Ub-binding site (orange) on the surface of Ddi1UBA (blue) based on the CSPs from panel (D). The CSP threshold in (B) and (E) was set to 0.1 ppm. (F) Representative titration curves for selected Ddi1UBA residues. (G–H) Structure of the complex of Ub (orange) and Ddi1UBA (blue): (G) backbone traces of 10 lowest-energy HADDOC-derived structures of Ub:Ddi1UBA complex, and (H) cartoon representation of the best structure of the complex. The location of the secondary structure elements in Ub and Ddi1UBA is shown in the top portions of the graphs in (A) and (D), respectively. (See also Fig S5)

