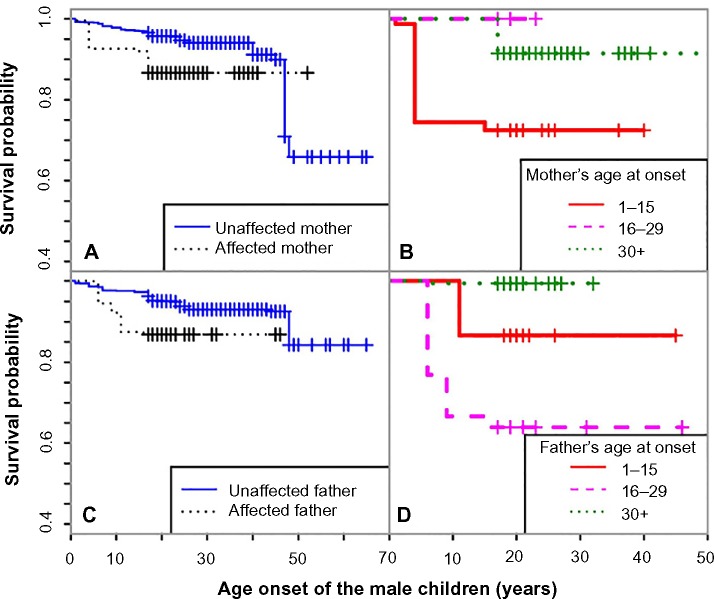
Figure 3.
Kaplan–Meier curves for male children across groups with different parental risks, between male children with affected and unaffected mothers (A), between male children with affected mothers with increasing age of onset (B), between male children with affected and unaffected fathers (C), and between male children with affected fathers with increasing age of onset (D).

