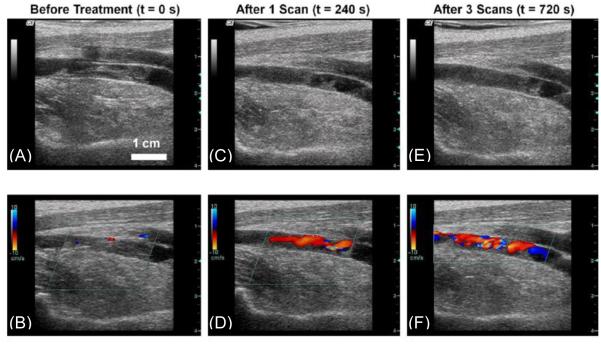
Figure 4.
Ultrasound images of the femoral vein captured by a linear array imaging probe between treatments of a thrombus. (A) and (B) show the original appearance of the vessel on 2D imaging and with color Doppler. (C) and (D) show the thrombus after 240 seconds of treatment (one scan). (E) and (F) show the final condition of the clot after 720 seconds (three scans). Note the decreased echogenicity in the lumen on (C) and (E) compared with (A). Also, a flow channel is clearly visible on (D) and (F), while none was present before treatment in (B). (This figure is adapted from [68])

