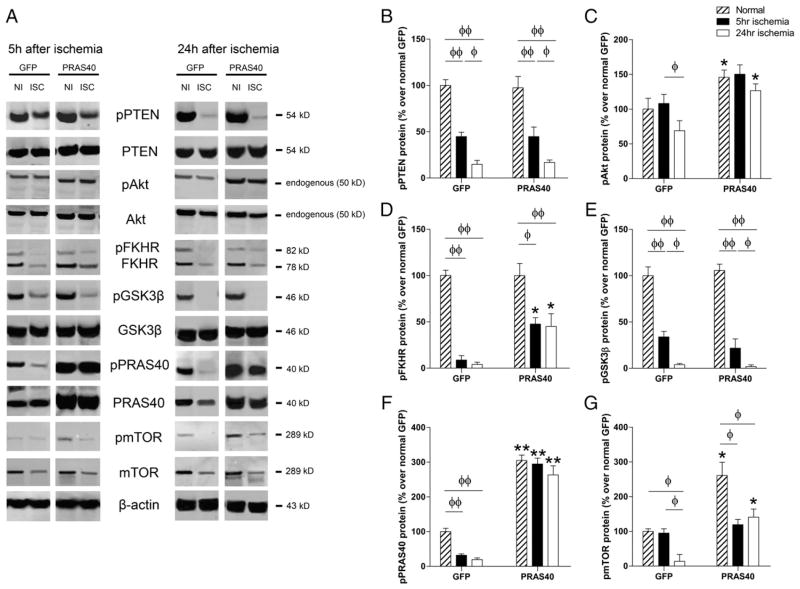
Fig. 3.
The effects of gene transfer of PRAS40 on protein expression in the Akt/mTOR pathways 5 h and 24 h after stroke. A. Representative protein bands of critical molecules in the Akt/mTOR pathways, including phosphorylated and total protein expression, as measured by western blot. All protein bands presented are derived from the same gel, but were cut and re-arranged for convenient comparison (see Supplementary Fig. 5). B, C, D, E, F and G show the quantified protein levels of p-PTEN, p-Akt, p-FKHR, p-GSK3β, p-PRAS40 and p-mTOR, respectively. *, **P < 0.05, and 0.01, respectively, vs corresponding normal or ischemic brain transfected with control GFP vectors. Φ, ΦΦ show significance difference between the two indicated groups, P < 0.05, and 0.01, respectively.

