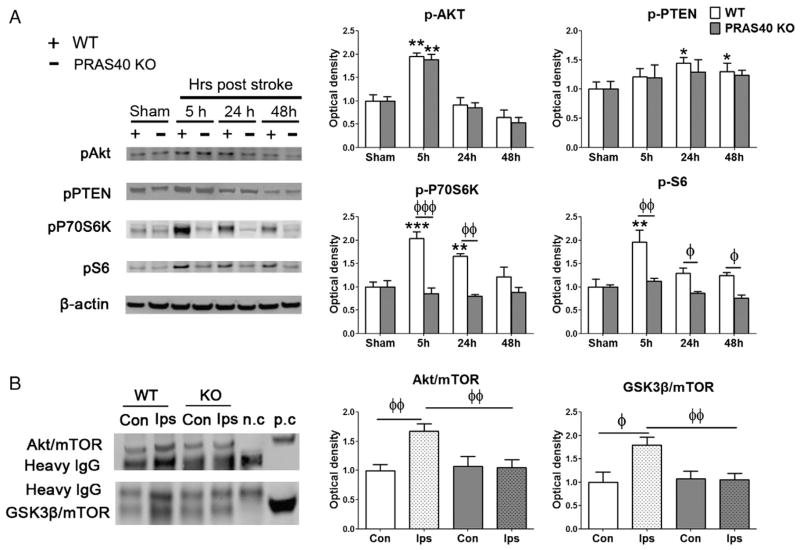
Fig. 5.
PRAS40 KO did not alter protein levels of p-Akt and p-PTEN, but inhibited protein levels of p-P70S6K and p-S6, and inhibited interactive effects between mTOR with Akt and GSK3β. A. The left shows western blot of representative protein bands for p-Akt, p-PTEN, p-P70S6K, and p-S6. β-actin was probed to show even loading of protein samples. Bar graphs on the right show average protein levels, which were normalized to the amount of sham animals and expressed as percentages. B. Left: Representative protein bands derived from co-immunoprecipitation analysis for interactive effects between mTOR with Akt or GSK3β. Proteins were co-immunoprecipitated using anti-mTOR antibodies, and extracted proteins were analyzed by western blot. Anti-Akt and anti-GSK3β antibodies were used to measure Akt and GSK3β protein levels that physically interact with mTOR. Both positive (whole-brain extract) and negative controls (prepared with protein A/G plus agarose without mTOR antibody) measuring Akt and GSK3β proteins were used. Right: Bar graphs of Akt and GSK3β protein levels. Con, contralateral side; Ips, ipsilateral ischemic side; n.c., negative control, p.c., positive control. *, **, ***P < 0.05, 0.01, and 0.001, respectively, vs sham; ϕ, ϕϕ, ϕϕϕ,P < 0.05, 0.01, and 0.001, respectively, between two indicated groups.

