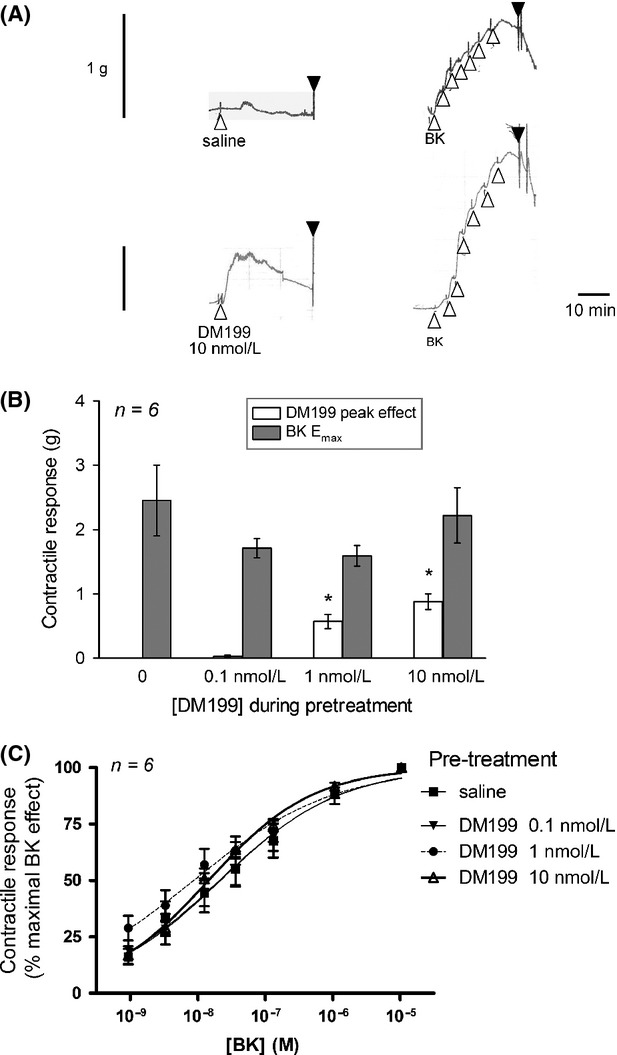
Figure 3.

Effect of pretreatment with DM199 (0.1–10 nmol/L) or its saline vehicle on the subsequent full cumulative concentration-effect curve of BK. (A) Representative tracings of the two extreme conditions, 10 nmol/L DM199 and saline vehicle. Presentation as in Figure1. The concentration levels reached after successive additions of BK are 0.94, 3.3, 12.7 36.2, 131, 1074, and 10,500 nmol/L. (B) Amplitude of the maximal DM199-induced contraction and that of later recorded BK-induced maximal contraction (g). The latter set of values did not differ between groups, but the former did (P < 10−4, ANOVA). *P < 0.01 vs. control (Dunnett's test). (C) Concentration-effect curves of BK-induced contraction as a function of the pretreatment (expressed as a percent of the maximal effect). The 95% confidence limits of BK EC50 values overlapped under all experimental conditions.
