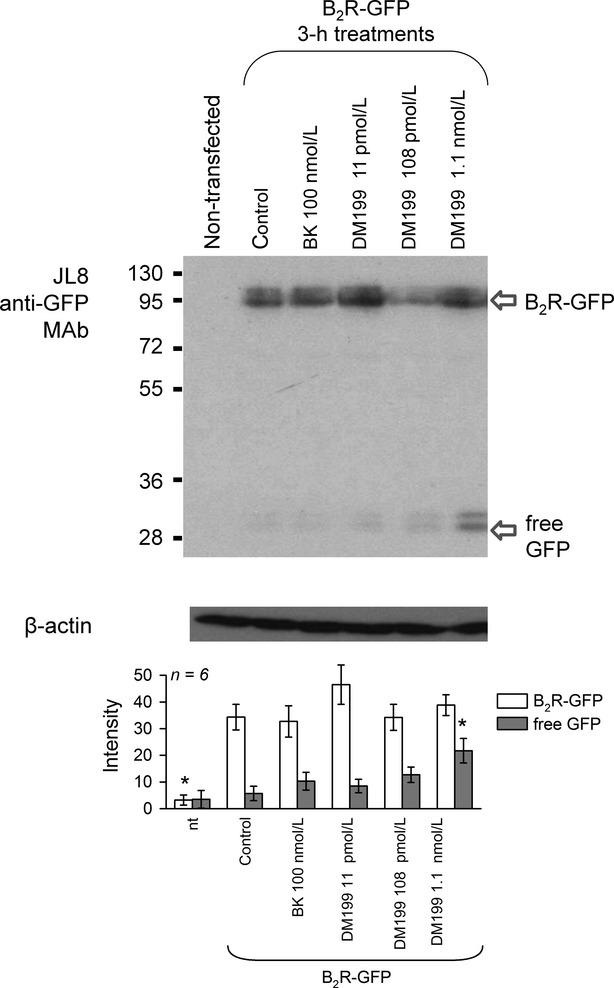
Figure 7.

Immunoblot of GFP or GFP-tagged B2R in total extracts of HEK 293 cells that stably express B2R-GFP. Cells maintained in their serum-containing culture medium were treated for 3 h as indicated. Bottom: Scanning intensity of relevant bands in replicated experiments. ANOVA showed that B2R-GFP bands significantly varied among groups (P < 10-4) and also that free GFP values were significantly heterogeneous (P < 0.01). *P < 0.01 versus values of control cells (second set of histograms from the left; Dunnett's test).
