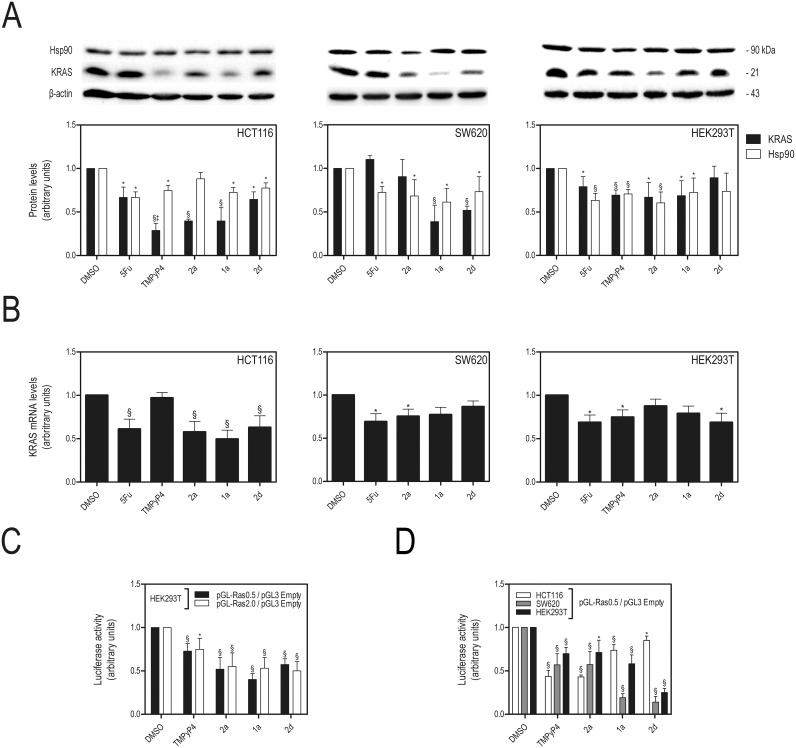
Fig 6. Exposure to IQ3A compounds decreases HSP90 and KRAS mRNA, protein expression and KRAS transcription.
A. KRAS and HSP90 protein steady-state expression evaluated by immunoblot relative to DMSO (vehicle control), after 72 h exposure to equitoxic (IC50) concentrations of 5-FU, TMPyP4 and IQ3A treatment; B. KRAS mRNA steady-state expression was evaluated by Taqman Real-time RT-PCR using specific Taqman Assays for KRAS and β-Actin for normalization. KRAS mRNA steady-state expression levels were calculated by the ΔΔCt method, using DMSO (vehicle control) for calibration; and C. HEK293T cells were co-transfected with pGL3-basic vector (empty vector control), or with KRAS promoter luciferase reporter construct PGL-Ras0.5, or PGL-Ras2.0, together with pRL-TK. Twenty-four hours later, cells were replated in 96-well plates, at 5.000 cells per well. Subsequently, 24 h after replating, cells were exposed to IC50 equitoxic concentration of test compounds IQ3A, TMPyP4 and vehicle (DMSO); D. HCT116, SW620 and HEK293T cells were co-transfected with pGL3-basic vector (empty vector control), or with KRAS promoter luciferase reporter construct PGL-Ras0.5, together with pRL-TK. Twenty-four hours later, cells were replated in 96-well plates, at 5,000 cells per well and exposed to IC50 equitoxic concentration of test compounds IQ3A, TMPyP4 and vehicle (DMSO). KRAS promoter activity levels were evaluated by Dual-Luciferase assay 72 h (C.) or 24 h (D.) after compound exposure. Results are expressed as the luciferase signal ratio of pGL-Ras2.0 or pGL-Ras0.5 to pGL3-basic vector transfected cells, after normalization with Renilla Luciferase. Results are expressed as mean ± SEM of at least three independent experiments; *p < 0.05 and §p < 0.01 from DMSO (vehicle control); and †p <0.05 and ‡p < 0.01 from 5-FU.

