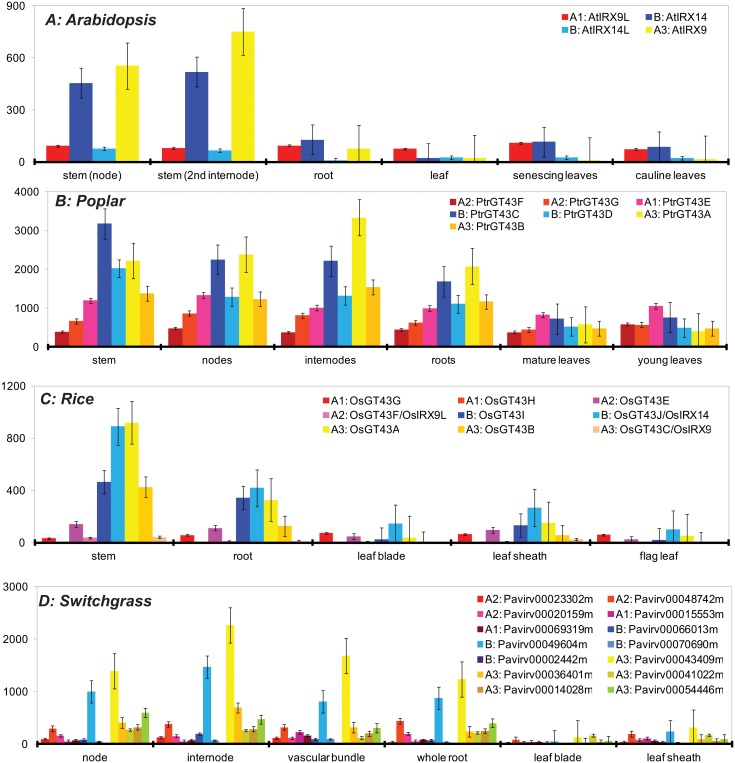
Fig 4. Expression profiles of GT43 genes.
In Arabidopsis (A), poplar (B), rice (C) and switchgrass (D). Some genes do not have any probes in the microarray data and were excluded. Inset legends, A1, A2, A3 and B are the clade names followed by the gene names according to Fig 2 and Fig 3. For each tissue, genes are ordered and colored based on their clades: A in red, B in blue and C in yellow. The y-axis shows the expression values from microarray data. A complete version of this figure is available as S3 Fig.

