
Fig 5. Mapping of vascular leakage in severe bTBI and naïve controls.
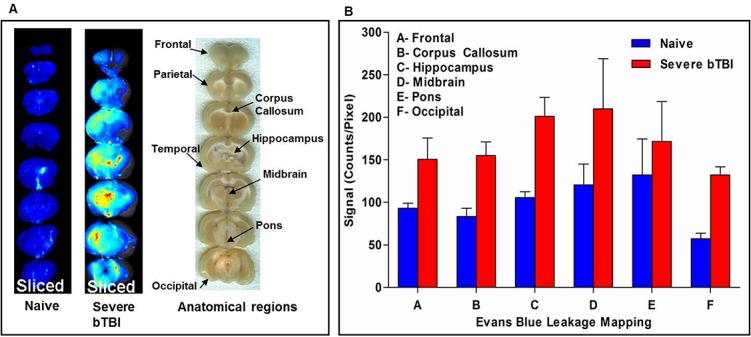
For quantitative mapping of EB leakage, the entire brain was sliced into seven 2 mm thick sections. The brain sections were imaged at 24 h post-injury. A) Brain slices (left columns) represent optical images of brain tissue sections from severely injured group depicting an increase in EB dye leakage in the periventricular area (corpus callosum and hippocampus) and the occipital lobe. In control animals (without bTBI), EB dye leakage is seen in the choroid plexus and circumventricular organs, where there is no BBB. An actual photograph (right column) of the sliced brain sections (taken using HP Scanjet G4010) showing the different anatomical areas of interest. B) Mapping of EB dye leakage comparing naïve control and severe bTBI (120–125 psi) brains from six different anatomical areas: frontal lobe, corpus callosum, hippocampus, mid brain, and pons.