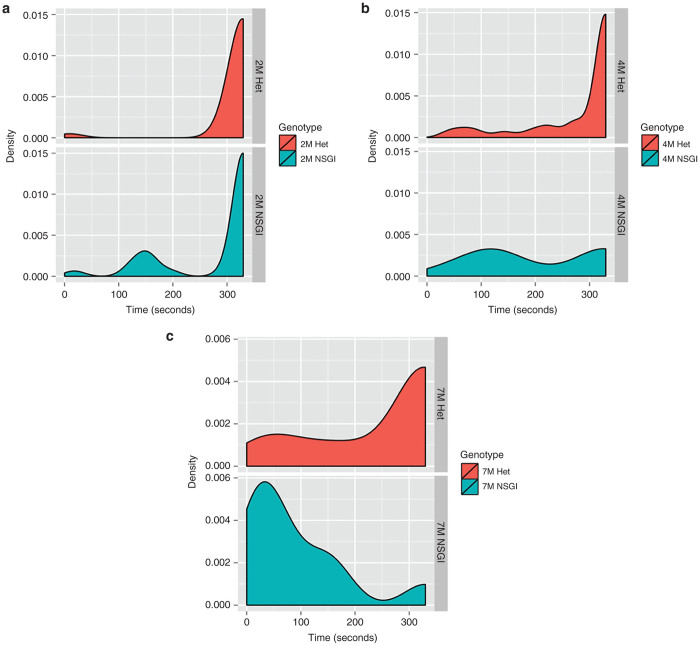
Figure 4.
Rotarod density plots show the relative likelihood that a mouse, based on age and genotype, will fall at a given time (seconds) versus the probability density function (“density”) which is determined by the distribution of the raw data. (a) Hets and NSGI mice at 2 months of age performed equally well in the rotarod test (P > 0.05). (b) A slight shift to the left is present for 4-month-old NSGIs indicating poorer performance compared to Hets (P < 0.05) and compared to 2-month-old NSGI (P < 0.05) while there is no change in 4-month-old Hets from the 2-month-old Het group (P > 0.05). (c) In 7-month-old NSGIs, the time of falling is extremely low (note the large shift to the left) while a large portion of the Het population can still complete testing to 330 seconds; the difference is highly significant (P < 0.001). The 7-month-old NSGI mice also performed worse than their 4-month-old counterparts (P < 0.001) while 7- and 4-month-old Hets had no statistical difference (P > 0.05). Each group has n = 8.

