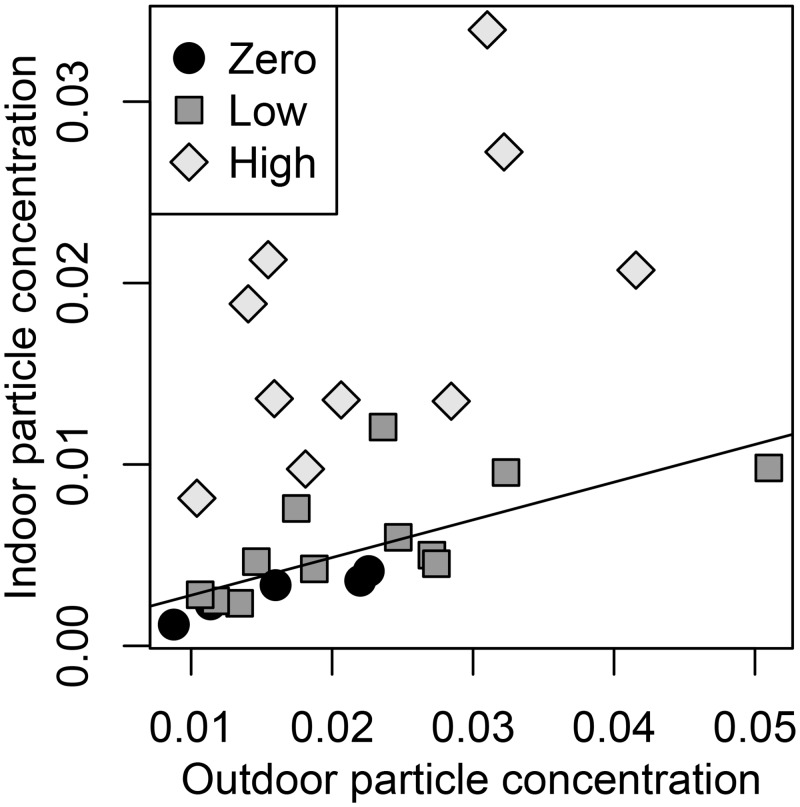
Fig 3. Mean concentrations of particles larger than 5 microns.
Concentrations were evaluated with optical particle counters during experiments that occurred over 10 calendar days and when the carpet was exposed or covered in a plastic sheet. Values show particle numbers per cm3 air. Low occupancy periods had 1 or 2 people sitting, and high occupancy periods had 2 people walking or 8 people sitting. The linear regression is based on zero and low occupancy periods.

