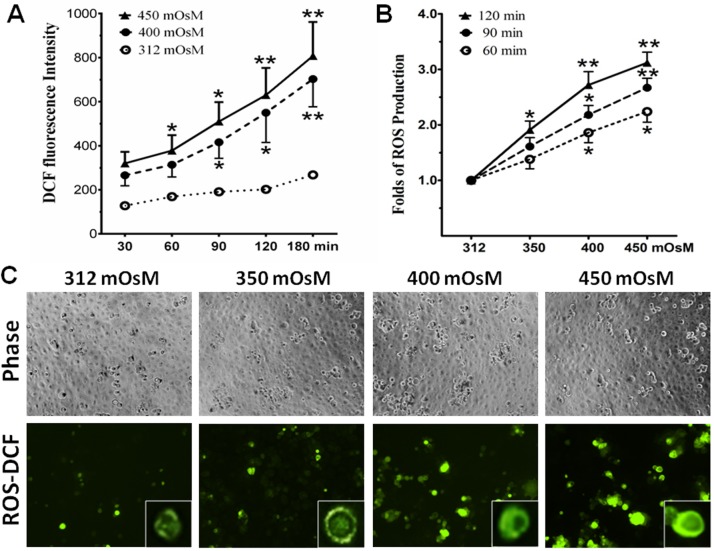
Fig 1. Hyperosmolarity stimulated ROS production in HCECs.
A. Time course graph displayed a time-dependent increase of DCF fluorescence intensity in HCECs exposed to media with 400 and 450 mOsM for 30–180 min. B. A graph displayed osmolarity-dependent increase of relative folds of ROS production normalized by 312 mOsM control group in HCECs exposed to media with 350, 400 and 450 mOsM for 60, 90 and 120 min. Data showing Mean±SD, n = 5, * P<0.05, ** P<0.01, compared with 312 mOsM normal control. C. Representative images with inserts of enlarged single cell showed ROS-DCF fluorescent positive cells in HCECs exposed to media with 312–450 mOsM for 120 min; the phase images showed equal cell density in 4 groups. Magnification 100x.

