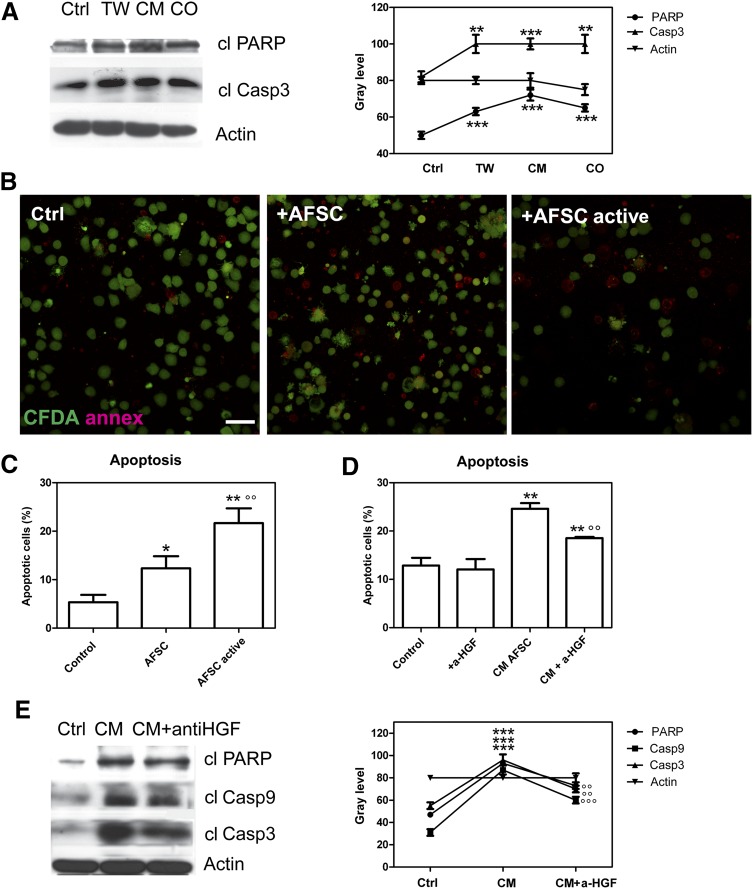
Figure 3.
Apoptosis of immune cells exposed to human AFSC (hAFSC) coculture. (A): Western blot analysis of lysates of peripheral blood mononuclear cells (PBMCs) exposed for 3 days to hAFSCs by conditioned medium, Transwell condition, or direct contact. Then immunoblot directed to cleaved PARP and caspase 3 was performed. Presented data are representative of three independent experiments, and the gray density values are shown in the graph. ∗∗∗∗, p < .0001; ∗∗, p < .01. (B): Representative immunofluorescence images of annexin V (red) and CFDA (green) labeling of PBMCs exposed for 3 days to media (CM) obtained from 5 days of hAFSCs preactivated (AFSC active) or not (AFSC). (C): Representative fluorescence-activated cell sorting (FACS) analysis of propidium iodide (PI) fluorescence of lymphocytes exposed for 3 days to media (CM) obtained from 5 days of hAFSCs preactivated (AFSC active) or not (AFSC) for 24 hours. ∗, p < .05; ∗∗, p < .01 vs. control; °°, p < .01 vs. AFSC. (D): Representative FACS analysis of PI fluorescence of lymphocytes cultured alone, after exposure to CM of activated hAFSCs, and in presence of anti-HGF neutralizing antibodies. Histograms represent the means of three different experiments ± SD. ∗∗, p < .01 vs control; °°, p < .01 vs. AFSC CM. (E): Western blot analysis of lysates of PBMCs exposed to CM of activated hAFSCs and in the presence of anti-HGF neutralizing antibodies revealed cleaved PARP and caspase 3 and 9. Actin detection was performed to show the amount of protein loaded in each line. Presented data are representative of three independent experiments, and the gray density values are shown in the graph. ∗∗∗, p < .0001 vs. control; °°°, p < .0001; °°, p < .01 vs. CM. Abbreviations: AFSC, amniotic fluid stem cells; a-HGF, anit-hepatocyte growth factor; Casp3, caspase 3; cl, cleaved; CM, conditioned medium; CO, direct contact; Ctrl, control; TW, Transwell.

