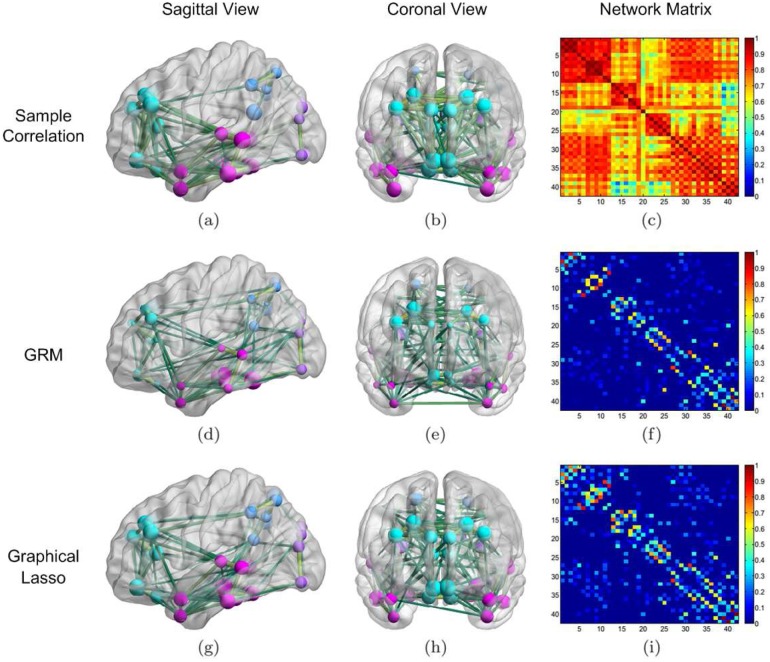
Fig 4. Network learning results of the AD group.
Reconstruction results by the GRM (2nd row) from 30 AD subjects compared with those by sample correlation (1st row) and graphical Lasso (3rd row). We plotted the sagittal and coronal views of the thresholded networks in the first two columns, where 144 prominent links are shown for all cases. The colors and sizes of the nodes indicate the associated brain lobes (frontal lobe is cyan; temporal lobe is pink; parietal lobe is blue; occipital lobe is purple) and node degrees, respectively; the thicknesses of the edges encode the connection strengthes. Those figures were generated by BrainNet Viewer (http://www.nitrc.org/projects/bnv/). We used s = 2, β = −0.003 and ρ = 0.002 to simulate (f) and (i), respectively. To ease visualization, we removed the diagonal entries when displaying the graph Laplacian and partial correlation matrices.

