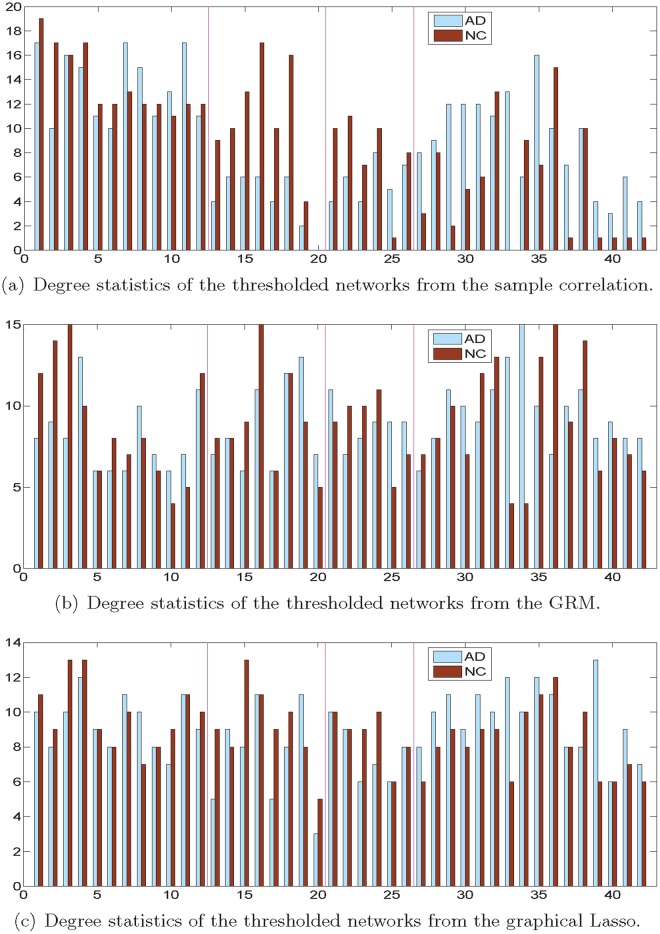
Fig 7. Degree distributions of the thresholded networks.
Degree distributions of the thresholded AD and NC networks obtained by different methods. The horizontal and vertical axes correspond to the brain region index and vertex degree, respectively. The magenta lines delineate the four brain lobes: namely, the frontal, parietal, occipital, and temporal lobe (from left to right).

