
Fig 8. Comparison between the AD and NC networks learned by GRM.
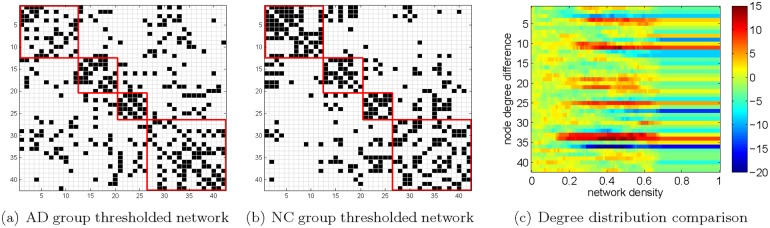
(a)-(b) correspond to the adjacency matrices of thresholded networks with both 187 edges, respectively; (c) visualizes the degree distribution differences between the AD and NC networks, with respect to the network density. Both the horizontal and vertical axes in the first two diagrams represent the brain region index.