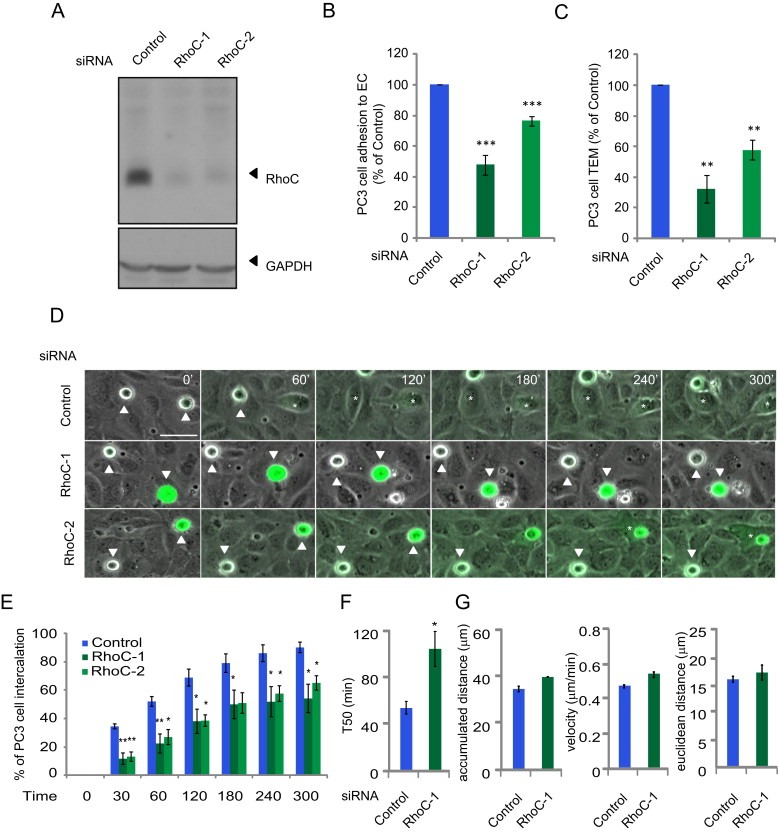
Figure 1.

RhoC regulates cancer cell adhesion to and intercalation between endothelial cells.(A) Lysates of PC3 cells transfected with indicated single siRNAs were immunoblotted with antibodies to RhoC, and GADPH as a loading control. (B) CFSE‐labelled PC3 cells transfected with the indicated siRNAs were added to HUVECs for 15 min and % adhesion relative to control siRNA‐transfected cells determined. Values are means ± SEM (n = 3); ***p < 0.001. (C) CFSE‐labelled PC3 cells transfected with the indicated siRNAs were added to HUVECs grown on a transwell insert for 8 h and % transmigrated cells relative to control siRNA‐transfected cells determined. Data are expressed as % of total cells± SEM (n = 3); **p < 0.01. (D) CFSE‐labelled‐PC3 cells transfected with the indicated siRNAs were filmed for 300 min on HUVECs. Asterisks mark PC3 cells that intercalate; white arrows indicate cells that have not intercalated. Scale bar, 50 μm. (E) Graphs show time of intercalation for individual cells transfected with the indicated siRNAs. Cells were filmed on HUVECs for 300 min. In each experiment ≥100 cells were analysed in at least 3 fields. Data are expressed as % of total cells. Values are means ± SEM (n = 3); **p < 0.01, *p < 0.05. See also Movie S1. (F) Time when 50% of PC3 cells have intercalated within ECs (T50). Values are means ± SEM (error bars; n ≥ 3); *p < 0.05. (G) Total distance migrated (left), velocity of cells (middle) and Euclidean distance migrated (right) of PC3 cells on top of ECs before intercalation.
