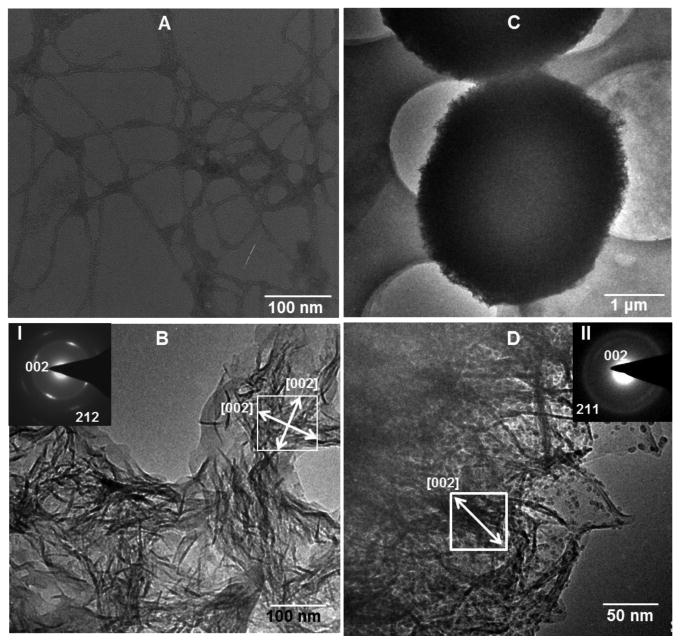
Figure 3.

TEM images of BS before (A, only interacted with Ca2+) and after (B-D) mineralized in 1.5 SBF at 37.2°C for 3 days (B) and 5 days (C,D). D is the high magnification image corresponding to C. Insets in B and D (I and II) are electron diffraction patterns taken from the area highlighted by a white square in B and D, respectively. White arrows indicate the [002] direction (i.e., the c-axis direction) of the HAP crystals.
