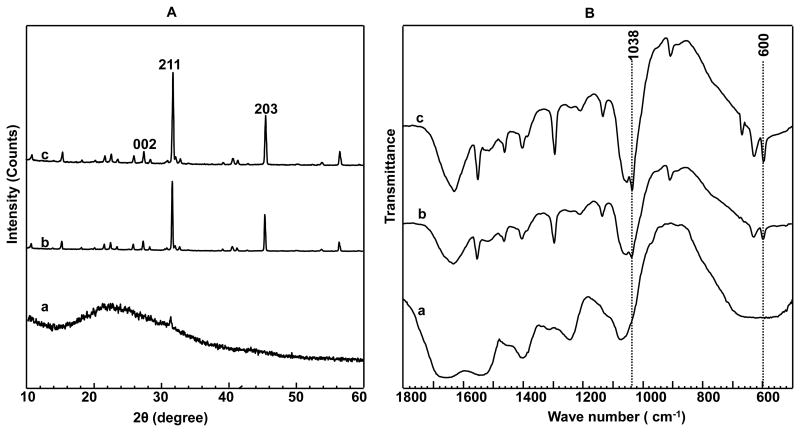
Figure 4.
(A) XRD patterns and (B) FT-IR spectra of BS before (a, only interacted with Ca2+) and after mineralized for different times (b, 3 days; c, 5 days). The appearance of the (203), (211) and (002) planes proved the nucleation of HAP crystals on the self-assembled BS matrix. The prominent peaks at 600 and 1038 cm-1 in B indicated the formation of HAP crystals on the BS.

