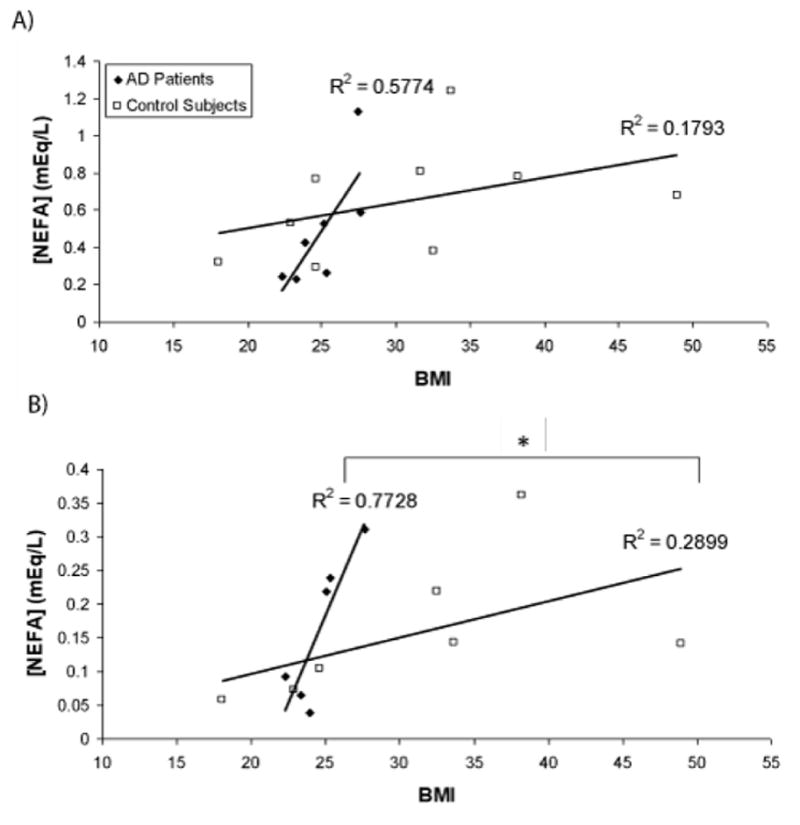
Figure 2.

The relationship between non-esterified fatty acid (NEFA) levels and body mass index (BMI) differs between Alzheimer’s (AD) patients and control subjects. Plasma samples were collected during fasting (A) or 3.5 hours following consumption of a moderately high-fat meal (B). NEFA levels are expressed as a function of body mass index (BMI) for each subject. The slope of the relationship between plasma NEFA levels and BMI is significantly steeper in the AD group (n=6) compared to the control group (n=7) at the 3.5 hour time point (*p<0.05, ANCOVA). The linear relationship between plasma NEFA levels and BMI for each group is shown as a solid dark line, with the corresponding R2 value noted to describe the strength of the relationship.
