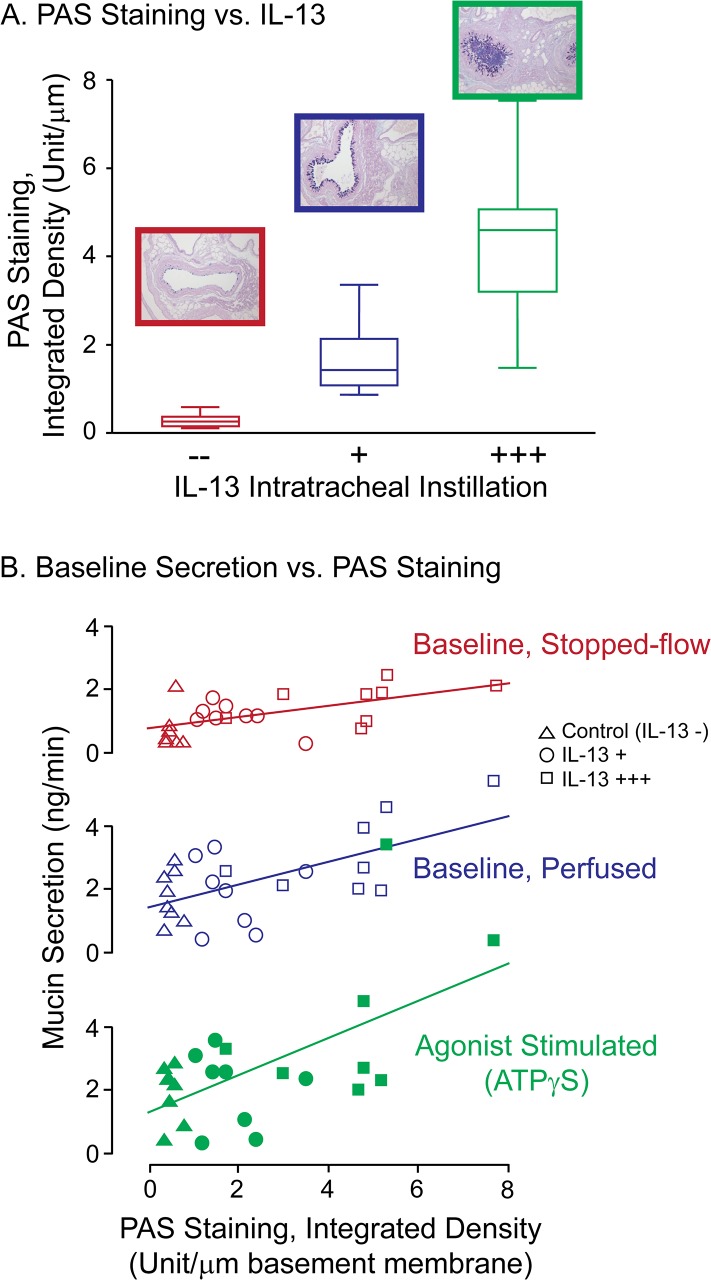
Fig 10. Effects of graded, IL-13 induced mucous metaplasia on WT mouse mucin stores and secretion.
IL-13 (1 μg/instillation), or a sham, control solution, was instilled via the trachea into the airways of anesthetized mice, following Treatment protocols 0 (—), 1 (+), and 3 (+++) in Table 1. At the appropriate times following the last instillation, tracheas were harvested for mucin secretion experiments and the right lung lobe of each mouse was fixed for histology. A. IL-13 Effects on AB/PAS staining in the airways. Sections of the major intralobar bronchi were stained with AB/PAS and the degree of AB/PAS staining was quantified using ImageJ. Note the progressive mucous metaplasia and in Treatment 3 (+++) the presence of mucus plugs. The data are expressed as the integrated density per μm of basement membrane, using Box Plots (25th, 50 th, 75 th percentiles). B. Relationship between AB/PAS staining and mucin secretion. Following IL-13 treatment, excised mouse tracheas were mounted for perfusion and equilibrated for 2 h, following which perfusion was stopped for the ‘Stopped-flow Baseline’, then restarted for the subsequent ‘Perfused Baseline’ and ‘Agonist Stimulated’ periods. The results are presented as scatter plots, with the measured mucin secretion rates, determined from subunit ELISAs, plotted against the AB/PAS Integrated Densities determined for the corresponding tissues from Panel A. Triangles, circles, and squares denote control and the 2 different IL-13 treatments, as indicated by the code, upper-right. Empty symbols denote secretions at baseline (stopped-flow and perfused) and filled symbols denote agonist-stimulated secretions. For the agonist-stimulated, IL-13+++ data (solid green squares), note the high value point that appears with the cluster of empty squares—to allow a simple visual comparison of the slopes, the scale for the agonist-stimulated data was not expanded to separate the data. All 3 slopes were significant, with correlation coefficients = 0.55, 0.61, and 0.59, and, with F ratio probabilities, p <0.005, <0.002, and <0.001.

