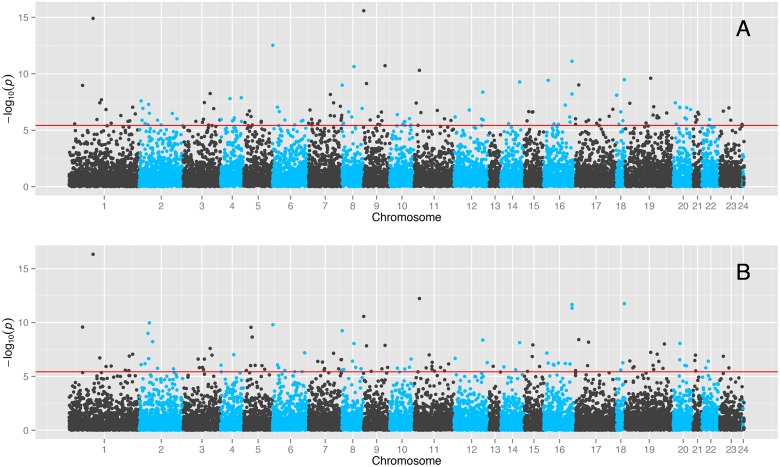
Fig 2. Manhattan plot of the cosinor seasonal analysis.
The −log10(p) of each cosinor regression model is plotted against the chromosomal location of each probe. Bonferroni correction significance line is added. A) Not corrected for cell count B) Corrected for cell count. Includes autosomal chromosomes 1–22, X(23), Y(24) and Mitochondrial(25).

