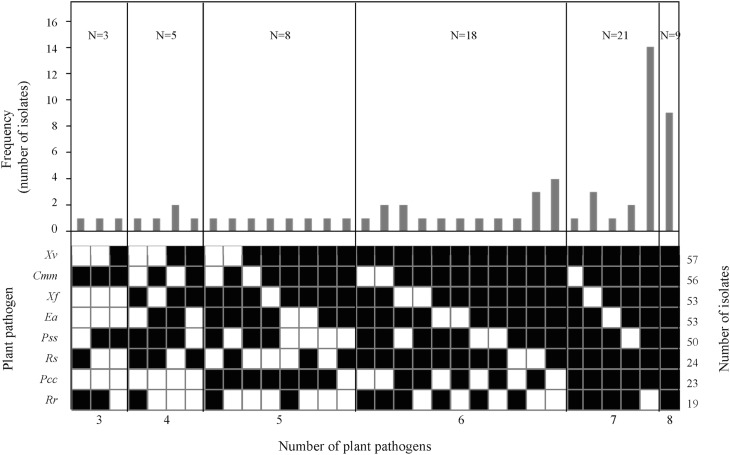
Fig 4. Frequency distribution of antibacterial activity in Bacillus isolates from field samples.
The number of isolates (N) within each group with antibacterial activity in LB and NA growth media against the same number of bacterial plant pathogens is indicated in the upper part of the panels. Total number of active isolates per pathogen is shown on the right part of the panel. The presence (■) or absence (□) of activity is also indicated.

