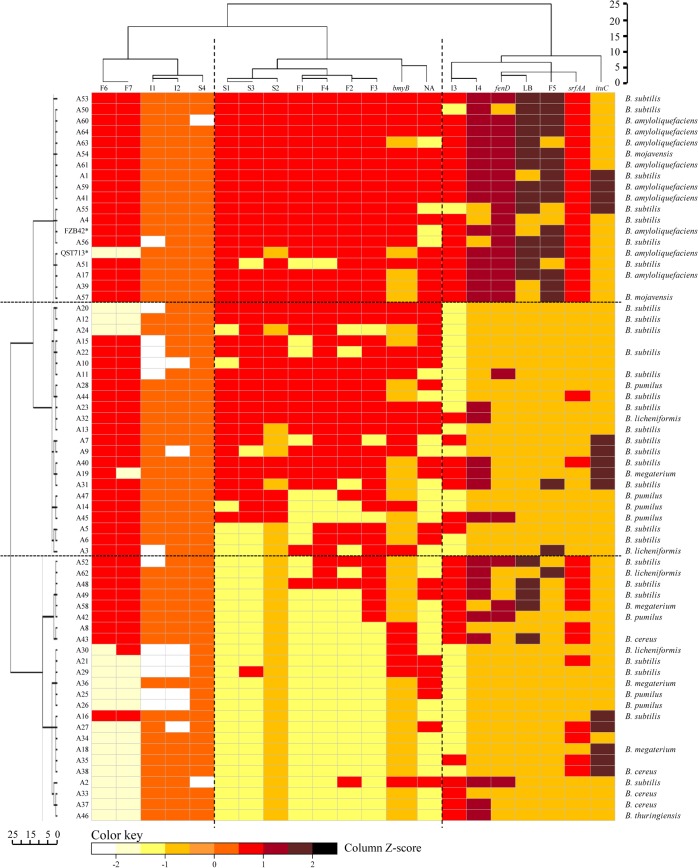
Fig 5. Two-way hierarchical clustering of Bacillus isolates.
The analysis was performed using as attributes the production of cLPs grouped by the three families of (iturins (I), fengycins (F) and surfactins (S), the presence of four cLP biosynthetic genes (srfAA, fenD, bmyB, and ituC), and antibacterial activity in LB and NA growth media. Strains QST713 and FZB42 are included as reference strains. The similarity matrix was calculated using the squared euclidean distance at the discretion of Ward’s. Cluster analysis was performed by the Agglomerative Hierarchical Group Method through the cluster analysis procedure of IBM-SPSS package. The colours correspond to the Z-scores of each attribute for a given isolate. The higher (or lower) the Z-score, the stronger the intensity of the clustering. A Z-score near zero indicates no apparent spatial clustering.

