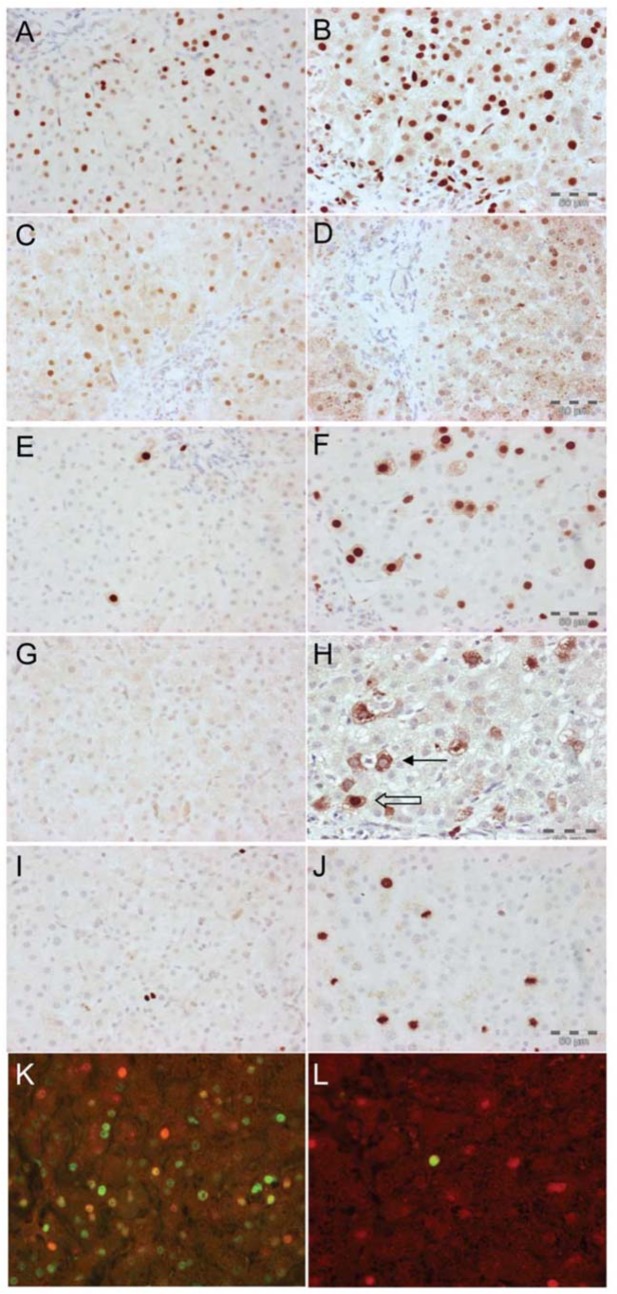
Fig 1. Hepatocytes are arrested in G1 in chronic HBV infection.
Immunoperoxidase staining using cell cycle phase-specific antibodies in a representative case of chronic HBV infection A—E. Immunofluorescence showing the relation between HBcAg expression and Mcm-2 (F) and cyclin A (G). A: Mcm-2 identifies cells that have entered the cycle. B: Cyclin D1, expression is maximal during G1. C: Cyclin A is expressed maximally during S phase. D: Cytoplasmic expression of Cyclin B1 during G2, nuclear and cytoplasmic expression. E: Phosphorylated histone 3 protein expressed in mitosis. F: Immunofluorescence for Mcm-2 (green) and HBcAg (red), showing frequent co-localisation (yellow). G: Immunofluorescence for cyclin A (green) and HBcAg (red). Co-localisation was never seen.

