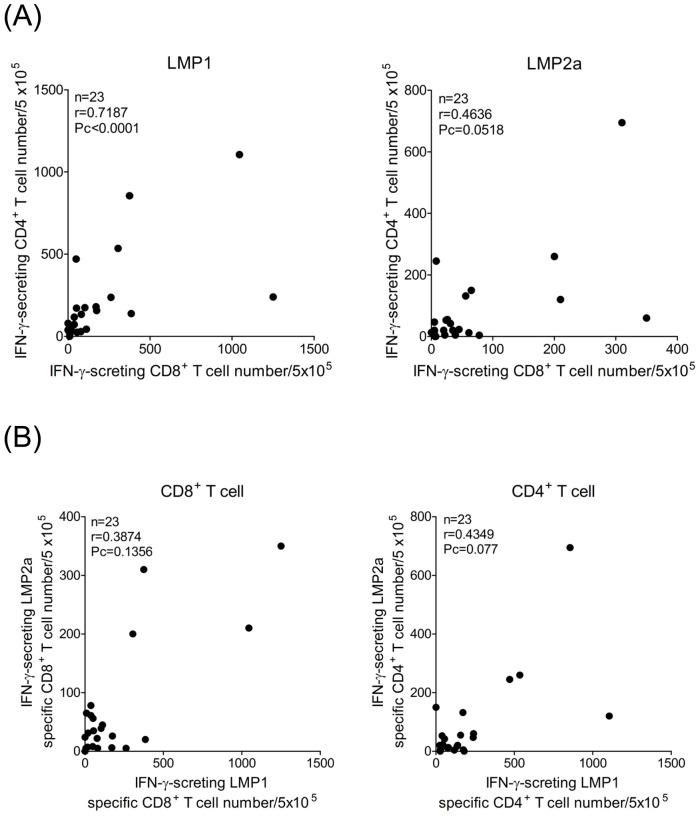
Fig 5. Correlations of estimates of LMP1- or LMP2a-specific T cell responses obtained using IFN-γ ELISPOT assay.
(A) Correlation between LMP1- or LMP2a-specific immune response from CD8+ T cells expressed on the x-axis and CD4+ T cells expressed on the y-axis. A significant correlation was observed for LMP1 between results obtained from CD8+ and CD4+ T cell responses (n = 23, r = 0.7187, Pc < 0.0001). (B) Correlation between LMP1-specific CD8+ and CD4+ T cell immune responses on the x-axis and LMP2a-specific CD8+ and CD4+ T cell responses on the y-axis.

