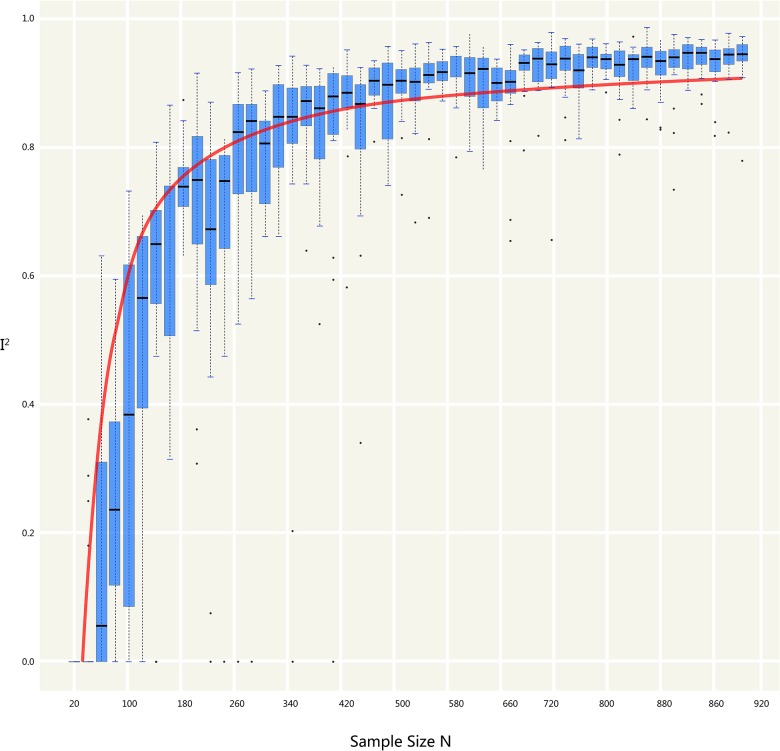
Fig 6. Impact of I2 and the sample size.
Lateral axis represents the sample size; vertical axis represents the I2 value. Boxes represent the distribution of I2 variations in synthesizing different number of trials (the sample size of each trial is the same). To each Si, sampling process will be repeated in 1000 times.

