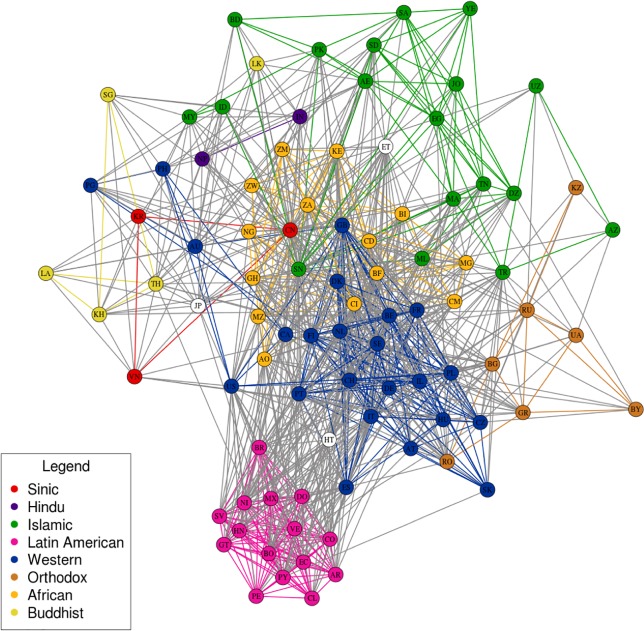
Fig 1. Countries are clustered based on the difference between observed and expected density of social ties in 90 countries with population above 5m, based on interpersonal email and Twitter communication.
To facilitate visualization, only the 1000 densest social ties are illustrated. Countries are color-coded according to location in one of Huntington’s eight civilizations. Fig 1 shows that the clusters are highly color specific, with a remarkably close correspondence to Huntington’s eight civilizations. Network layout using the Fructherman-Reingold algorithm [8].

