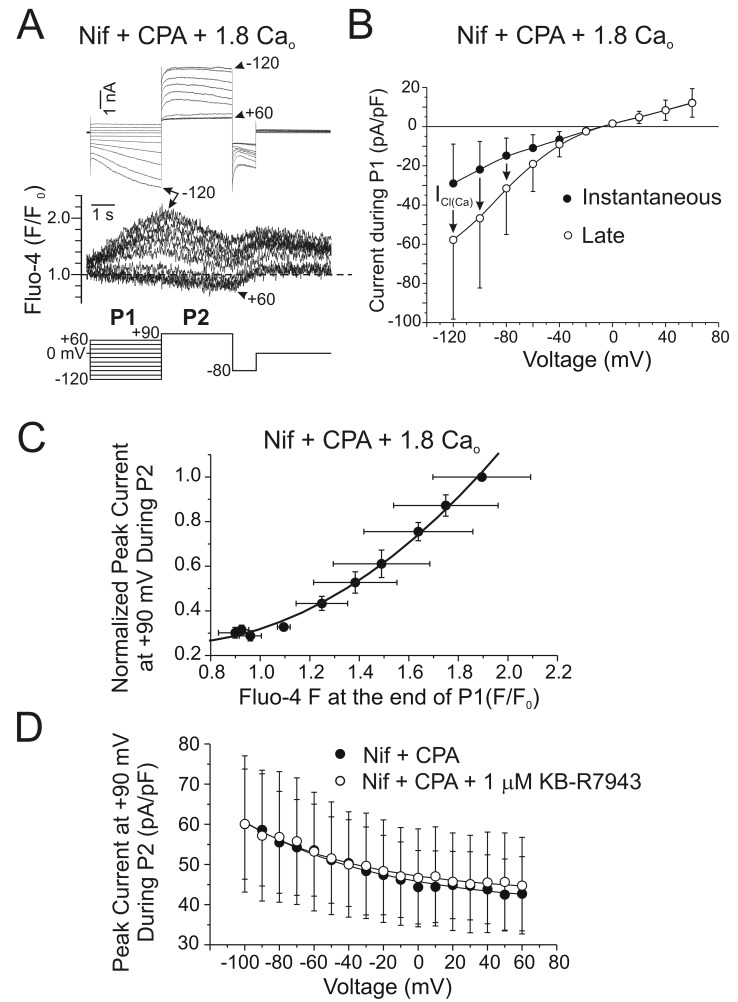
Figure 8.
Voltage dependence of Ca2+ transients and Ca2+-activated Cl− currents evoked by store-operated Ca2+ entry (SOCE) in rabbit pulmonary artery smooth muscle cells. A, Family of membrane currents and intracellular Ca2+ transients measured simultaneously with the Ca2+ indicator Fluo-4 (expressed as F/F0) elicited by the protocol shown below the traces. The traces were recorded after 5 minutes of incubation with 1 μM nifedipine (Nif) and 30 μM cyclopiazonic acid (CPA) in the presence of 1.8 mM Ca2+ to induce SOCE. B, Mean current-voltage relationships for the instantaneous (filled circles) and late (open circles) membrane currents recorded in the presence of 1.8 mM Ca2+ with Nif and CPA for experiments similar to the one described in A. Each data point represents the mean ± SEM (n = 3). C, Dependence of normalized peak current at +90 mV during P2 (see protocol in A) on the magnitude of the Fluo-4 signal measured at the end of P1 (see protocol in A). Each data point represents the mean ± SEM of normalized peak current during P2 and Fluo-4 fluorescence at the end of P1 (n = 3). The solid line represents a second-degree polynomial fit. D, Peak current at +90 mV during P2 (see protocol in A) as a function of voltage during P1. Currents were recorded in the presence of Nif and CPA (filled circles) before the addition of 1 μM KB-R7943 (open circles), a Na+/Ca2+ exchange blocker. Each data point represents the mean ± SEM (n = 9). The two solid lines represent least squares exponential fits. Reproduced from Angermann et al.138 with permission from the National Research Council of Canada.

