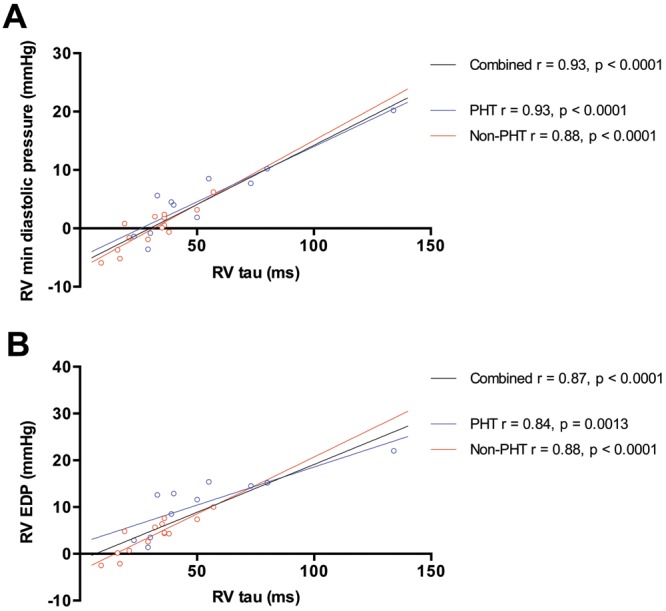
Figure 1.

Relationship between right ventricle (RV) τ and RV minimum diastolic pressure (A) and RV end-diastolic pressure (EDP; B). Patients with pulmonary hypertension (PHT) are represented by open blue circles, and patients without PHT are represented by open red circles. Regression lines are shown for patients with PHT (blue), patients without PHT (red), and both groups combined (black).
