
Figure 2. The svb E3N Enhancer Contains a Cluster of Ubx-Exd Binding Sites.
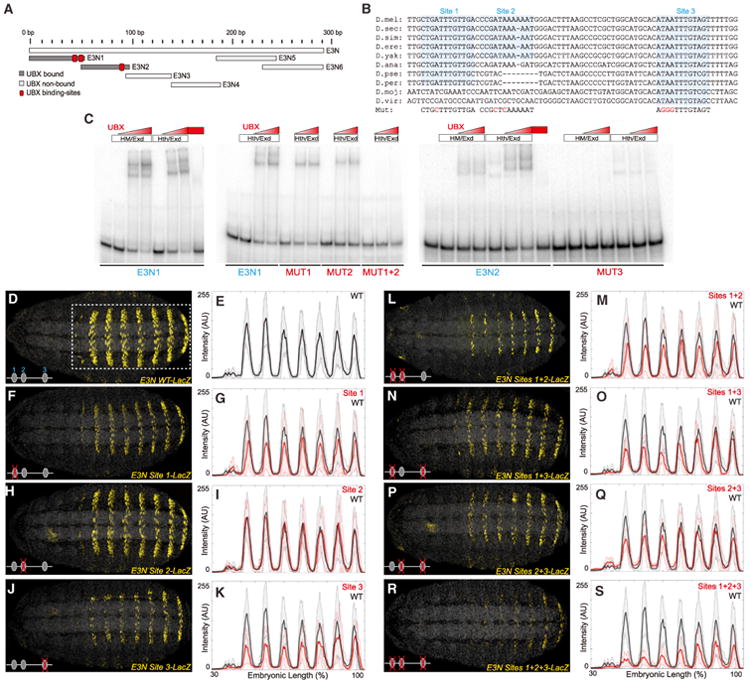
(A) A schematic of the regions tested for their ability to bind Ubx-Exd, assayed via EMSAs. See also Figures S2 and S3.
(B) Sequence alignment for the region of the E3N enhancer containing the three Ubx-Exd sites, labeled and highlighted. Dashes indicate gaps in the aligned sequence. Mutations of the Ubx-Exd binding sites are shown (Mut).
(C) Ubx-Hth-Exd bound specifically to each of the three sites, as demonstrated with EMSAs. In this and the following figures, Hth and HM refer to the full-length (HthFL) and homeodomainless (HthHM) isoforms of Hth, respectively.
(D–S) Expression of E3N∷lacZ reporter constructs with Ubx-Exd sites altered as indicated (B), juxtaposed with plots of average expression in the region outlined in (D) (n = 10 for each genotype). In all plots, the black and red lines denote expression driven by the wild-type and modified enhancers, respectively. Shaded areas indicate ±1 SD. AU, arbitrary units of fluorescence intensity.
See also Figures S4 and S5 and Tables S1 and S2.