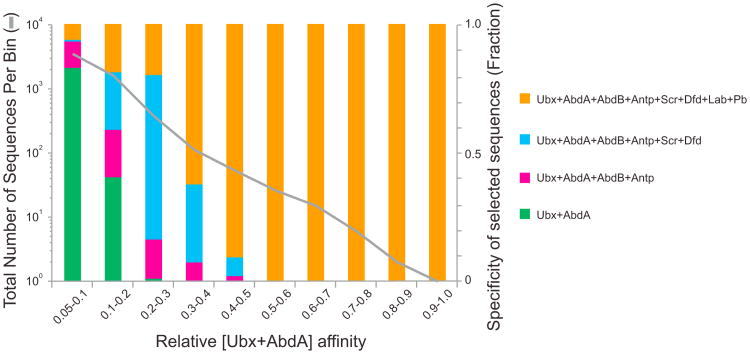
Figure 3. Inverse Correlation between Sequence Affinity and Specificity.
The proportion of 12mer sequences bound by various Hox-Exd complexes versus relative affinity of these 12mers for Ubx/AbdA-Exd is shown as colored bars (specificity groups). The number of 12mers in each affinity bin is plotted as a gray line. Average relative affinities of 12mers were calculated for four pairs of Hox-Exd complexes with similar binding profiles: (1) Labial and Pb, (2) Dfd and Scr, (3) AbdB and Antp, and (4) Ubx and AbdA. Sequences specific for Ubx/AbdA-Exd (green bars) are more prevalent in lower affinity bins than in higher affinity bins.

