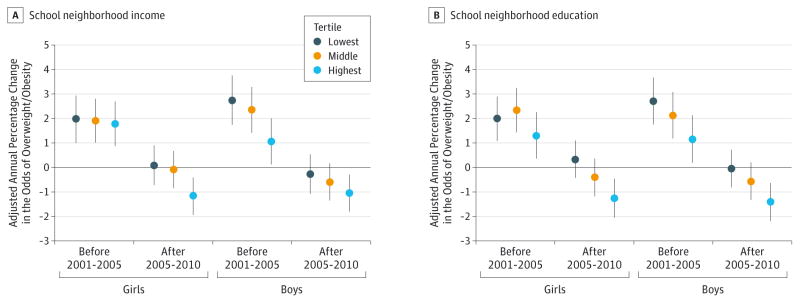
Figure 2. Adjusted Percentage Change in the Odds of Overweight/Obesity Per Year Comparing the Periods 2001–2005 and 2005–2010 by School Neighborhood Income (A) and Education (B) Levels and Sex.

The positive (negative) percentage change implies the prevalence is increasing (decreasing). After the competitive food and beverage policies took effect in elementary schools, only children attending schools in high-income or high-education neighborhoods demonstrate a decreasing overweight/obesity trend. Percentage changes are based on a multilevel logistic regression model, adjusted for age; race/ethnicity; fitness levels; and school-level enrollment, racial/ethnic composition, and proportion of children eligible for free or reduced-price meals. Models by neighborhood income additionally adjust for continuous neighborhood education; models by education additionally adjust for continuous income. Data are from Fitnessgram 2001–2010 on fifth-grade students, linked with school, district, and 2000 Census data. The error bars indicate 95% CIs.
