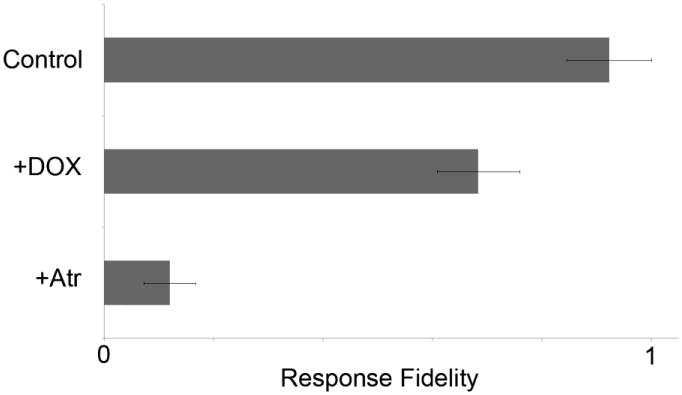
Fig. 4.

Drugs and protein expression levels also alter response fidelity in a cell population with cell-to-cell variability. Exposure to 1 μg/mL Doxycycline (DOX) increased RGS4 expression levels in our cells, leading to a reduction in calcium response fidelity (middle graph) compared to untreated cells. Cells treated with 1 nM Atropine (Atr) (bottom graph) showed significantly lower response fidelity compared to untreated cells. For each condition, cells were exposed to C = 25 nM Carbachol, D = 24 s, and R = 24 s. Bars represent the standard deviation. All conditions were statistically significant based upon the Student T-test, with p < 0.05.
