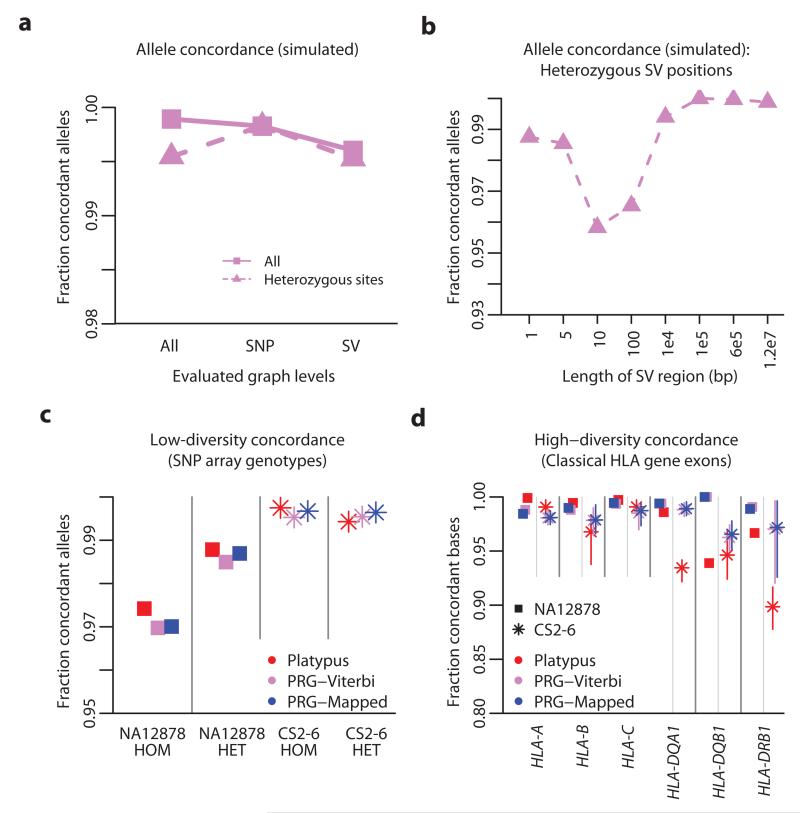
Figure 3. Simulation study and empirical validation.
a. Allele concordance between simulated data (20 simulated diploid individuals; 101bp reads at 30x diploid coverage with empirical error distribution) and Viterbi path through the PRG stratified by simulated variant type (SNP or structural variant; SV) and genotype. b. Allele concordance in simulations at sites heterozygous for structural variants of different lengths. c. Allele concordance between SNP array genotypes and chromotypes from each method for NA12878 (squares; Illumina Omni 2.5M array) and the CS2-6 samples (stars; Illumina 1M array), stratified by whether the array specifies the genotype as homozygous or heterozygous. Results are shown for the mapping-based approach (Platypus, red), the Viterbi-path through the PRG (PRG-Viterbi, pink) and after mapping to the reference chromotype (PRG-Mapped, blue). d. Allele concordance between classical HLA genotypes at HLA-A, HLA-B, HLA-C, HLA-DQA1, HLA-DQB1 and HLA-DRB1 (measured at a per-base level) and chromotypes from each method for NA12878 and the CS2-6 samples (range of accuracy across CS2-6 displayed as vertical bars). Classical HLA genotypes were inferred from sequence-based HLA typing (see Methods).

