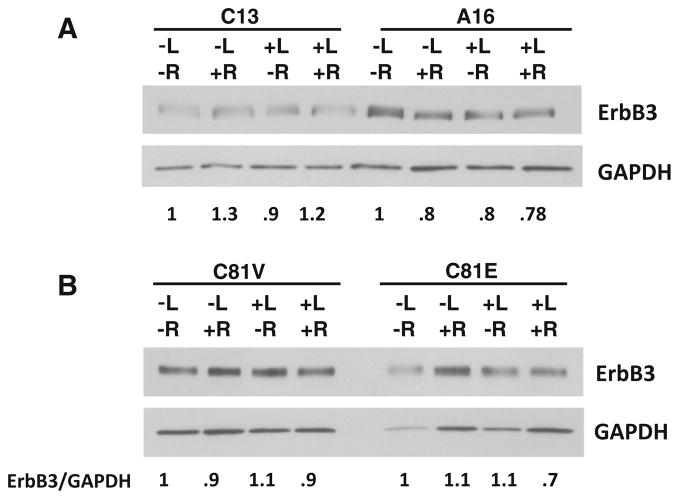
Fig. 5.
Effects of EBP1 expression on ErbB3 levels after lapatinib treatment. A16 and C13 (a) and C81V and C81E (b) cells were grown in androgen-depleted media for 3 days. R1881 (10−9) M and lapatinib (1 μM) were added as indicated 24 h prior to harvesting cells. Western blotting was performed for ErbB3 and GAPDH as indicated. Representative of 2 experiments. The numbers below the blots indicate the relative densities of ErbB3 normalized to GAPDH. The value of each untreated cell line was set at 1

